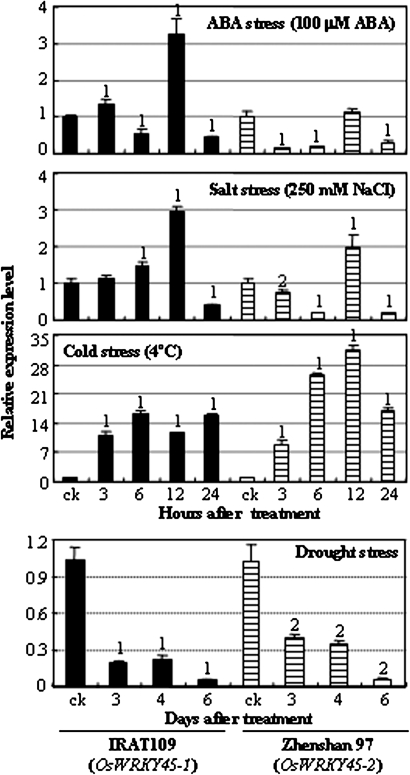
Fig. 1.
Expression patterns of OsWRKY45-1 and OsWRKY45-2 in response to ABA and abiotic stresses in rice cultivars IRAT109 and Zhenshan 97. Bars represent the mean (three technical replicates) ±standard deviation. The ‘1’ or ‘2’ indicates that a significant difference was detected between treated plants and untreated control (ck) at P <0.01 or P <0.05, respectively.

