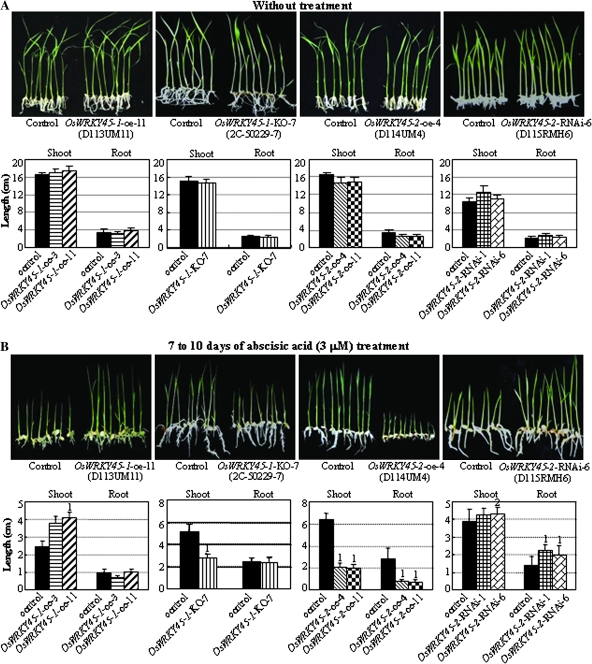
Fig. 2.
Modulating OsWRKY45-1 and OsWRKY45-2 expression influenced rice response to ABA treatment. Control, negative siblings from corresponding transgenic segregating populations. (A) Rice seedlings before ABA treatment. Plants grown on MS medium for 10 d. (B) Phenotypes of transgenic plants after ABA treatment. Rice seedlings were grown on MS medium containing ABA for 7–10 d (until the transgenic and control plants showed marked differences in growth rate) and then phenotypes were recorded. Bars represent the mean (8–10 plants) ±standard deviation. The ‘1’ or ‘2’ indicates that a significant difference was detected between a positive transgenic line and its negative control at P <0.01 or P <0.05, respectively. Similar results were obtained in two biological repeats and only data from one repeat are presented. Because of the varying durations of ABA treatment (7–10 d) in different groups of plants, the control plants with the same genetic background in the OsWRKY45-1-oe and OsWRKY45-2-oe groups exhibited different lengths of shoot and root.

