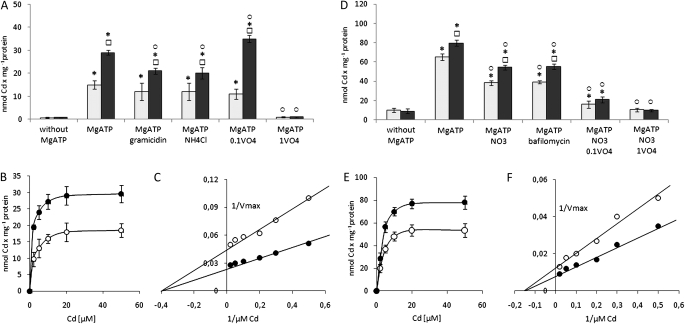
Fig. 2.
The properties of MgATP-energized Cd efflux across the plasma membrane (A–C) and tonoplast (D–F). Effect of MgATP, proton pump inhibitors and protonophores on Cd transport into everted plasma membranes (A) and right side-out tonoplasts (D) isolated from control (open squares) and Cd-treated (filled squares) plants. Cd was introduced into the incubation medium at a final concentration of 5 μM. The measurement was performed with use of AAS followed by a direct filtration assay. Presented values are means ±SD of three independent experiments, with each experiment done in triplicate. Squares indicate a significant difference (P <0.05) between control and Cd-treated plants, and asterisks indicate a significant difference (P <0.05) between Cd transport in the presence of MgATP and corresponding Cd transport measured without MgATP in the incubation medium. Circles indicate a significant difference (P <0.05) between Cd transport in the presence of MgATP and corresponding Cd transport measured with MgATP and protonophores, bafilomycin, nitrate or vanadate in the incubation medium. The Cd concentration dependence of MgATP-energized Cd transport into the plasma membranes (B) and tonoplast (E) isolated from control (open circles) and Cd-treated (filled circles) plants with apparent Km values of 2.5 μM and 6.6 μM estimated for plasma membrane-catalysed (C) and tonoplast-catalysed (F) Cd transport, respectively. The presented values are representative of the results obtained in 3–4 independent experiments with each experiment done in triplicate.

