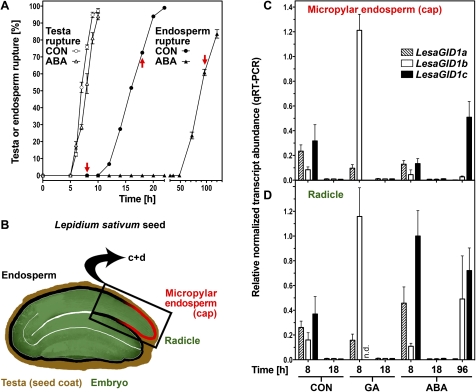
Fig. 5.
Transcript abundance patterns of the LesaGID1a, LesaGID1b, and LesaGID1c receptor genes in specific seed tissues of Lepidium sativum during germination. A, Time course analysis of testa and endosperm rupture of L. sativum FR14 seeds in medium without (CON) and with ABA added. Continuous light, 18 °C. Mean values ±SE of 3×50 seeds are presented. Red arrows indicate sampling time points for the qPCR. (B) Cross-section of L. sativum seed indicating the specific seed tissues used in the experiment: micropylar endosperm and radicle (lower 1/3 of the hypocotyl-radicle axis). (C, D) qRT-PCR analysis of LesaGID1a, LesaGID1b, and LesaGID1c transcript abundances for micropylar endosperm (C) and radicles (D) at 8, 18, and 96 h imbibition. ddCt expression values relative to validated constitutive transcripts are presented. Medium additions, as indicated: 10 μM GA4+7, 10 μM ABA. Mean values ±SE of 4×1000 micropylar endosperms and 4×200 radicles are presented; n.d.=not detectable. (This figure is available in colour at JXB online.)

