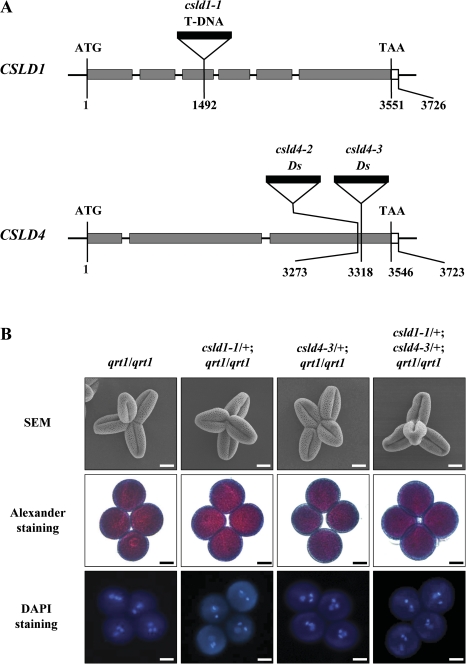
Fig. 1.
Isolation of CSLD1 and CSLD4 knock-out mutants. (A) Schematic diagrams of the CSLD1 and CSLD4 gene structures, showing the T-DNA and Ds insertion sites. The grey and white boxes indicate translated and untranslated regions, respectively. (B) Scanning electron microscopy (SEM) analysis, Alexander staining, and DAPI staining of quartets from qrt1/qrt1, csld1-1/+; qrt1/qrt1, csld4-3/+; qrt1/qrt1, and csld4-3/+; csld1-1/+; qrt1/qrt1, respectively. For SEM analysis, pollen grains were coated with gold particles. Bars: 10 μm.

