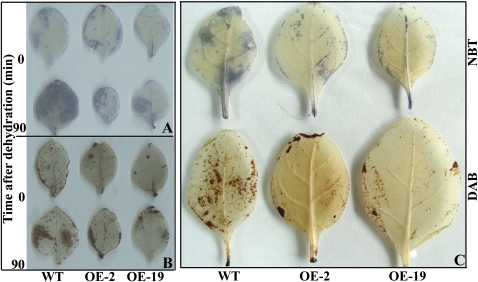
Fig. 10.
Accumulation of O2− and H2O2 in the WT and transgenic lines (OE-2 and OE-19) under dehydration or drought, as measured by histochemical staining with NBT and DAB, respectively. (A and B) Representative photographs showing staining of O2− (A) and H2O2 (B) in the leaves before (0, upper panel) and after dehydration (90, lower panel). (C) Representative photographs showing accumulation of O2− (upper panel) and H2O2 (lower panel) in leaves that have been subjected to drought for 21 d. (This figure is available in colour at JXB online.)

