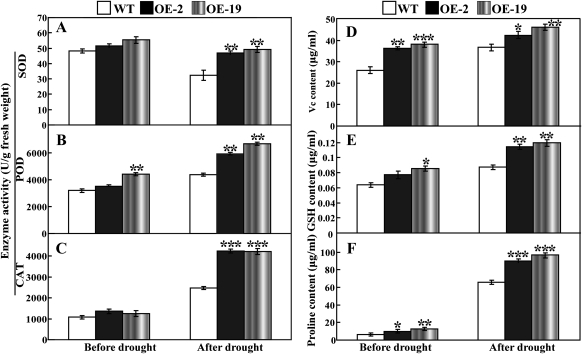
Fig. 11.
Analysis of enzyme activity and metabolite levels in the WT and the transgenic lines (OE-2 and OE-19) before and after drought treatment for 7 d. (A–C) Activity of SOD (A), POD (B), and CAT (C) in the three lines. (D–F) Content of ascorbic acid (D), GSH (E), and proline (F) in the three lines. Asterisks show that the values are significantly different between the transgenic lines and the WT at the same time point (*P <0.05; **P <0.01; ***P <0.001).

