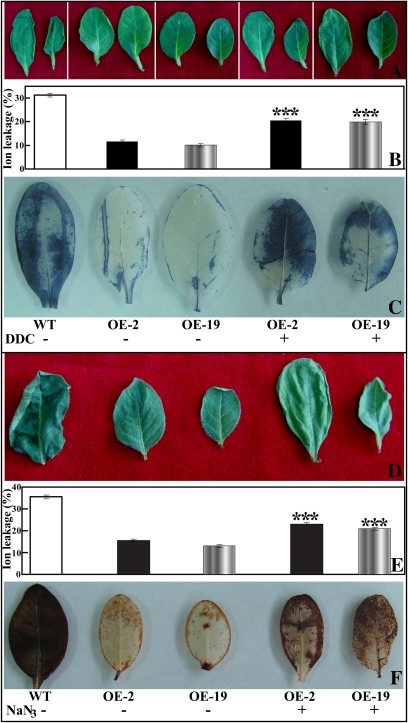
Fig. 12.
Effect of a SOD inhibitor (DDC) and a POD inhibitor (NaN3) on the dehydration response of the transgenic lines. (A and D) Representative photographs showing the morphology of leaves from WT, OE-2, OE-19, and DDC- (A) or NaN3- (D) treated OE-2 and OE-19 plants (from the left to the right). (B and E) Ion leakage of the samples indicated in A and D, respectively. Asterisks show that the value is significantly different between the transgenic line treated or not with the enzyme inhibitor. (C and F) NBT (C) and DAB (F) staining of the leaves from WT, OE-2, OE-19, and DDC- or NaN3-treated OE-2 and OE-19 plants. (This figure is available in colour at JXB online.)

