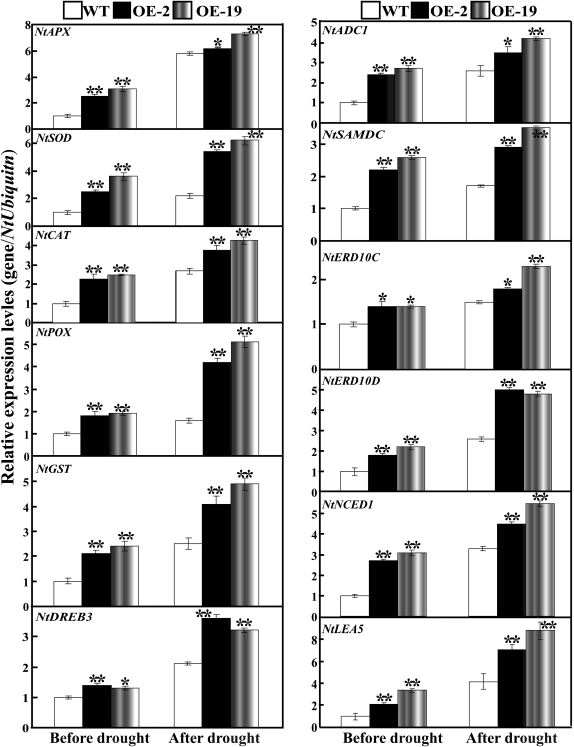
Fig. 13.
Quantitative real-time PCR analysis of expression levels of ROS-related and stress-responsive genes in the WT and the transgenic lines (OE-2 and OE-19) under normal and drought conditions. Data represent the means ±SE of four replicates. Asterisks show that the values are significantly different between the transgenic lines and the WT under the same growth conditions (*P <0.05; **P <0.01).

