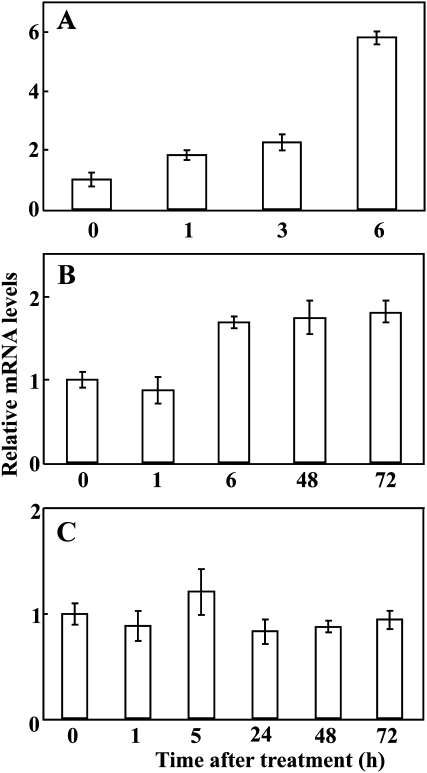
Fig. 3.
Expression patterns of PtrMAPK in trifoliate orange under dehydration (A), low temperature (B), and salt (C), as analysed by qRT-PCR. For each stress, the expression level at time point 0 (the beginning of the relevant treatment) was defined as 1.0, and the expression level at other time points was normalized accordingly. Error bars show standard deviations for four independent replicates.

