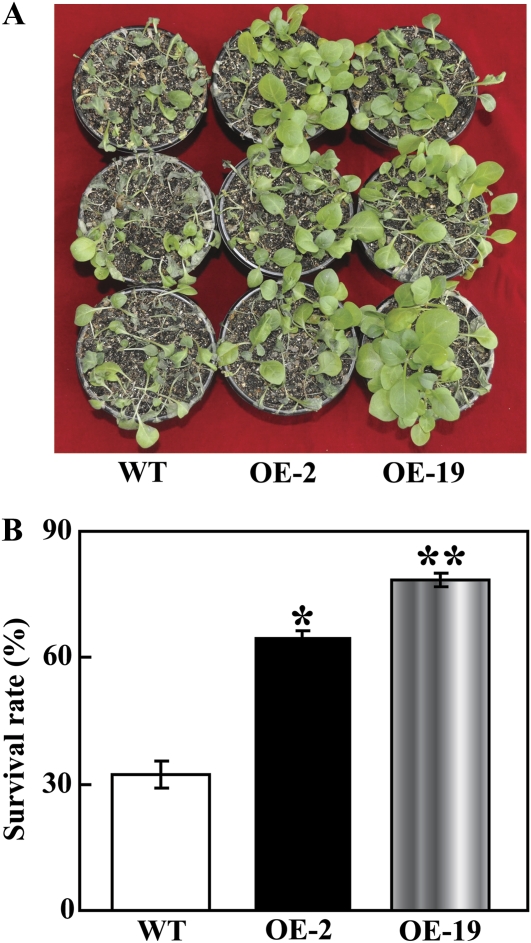
Fig. 7.
The transgenic lines exhibited a higher survival rate under drought and recovery when compared with the WT. (A) The photographs are of representative plants after drought for 20 d and a subsequent recovery for 3 d. (B) The survival rate in OE-2, OE-19, and the WT after the 3 d re-watering following the drought. Data are means ±SD calculated from three replicates. * (P <0.05) and ** (P <0.01) indicate that the value in the transgenic lines is significantly different from that of the WT. (This figure is available in colour at JXB online.)

