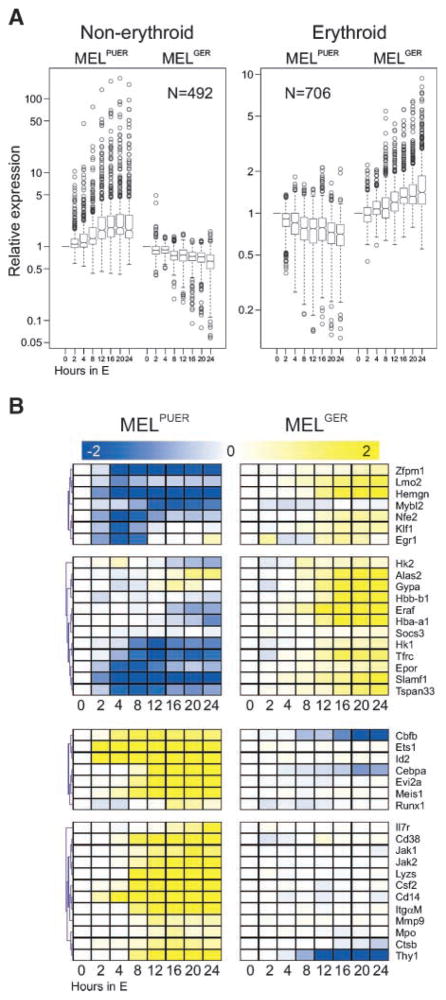
FIGURE 3.
Gene expression of MEL cells could be reprogrammed either by PU.1 into mixed non-erythroid or by GATA-1 into erythroid transcriptional programs. MELPUER and MELGER cells were cultured for 24 h (X-axis) in the presence of 17β-estradiol in a duplicate experiment. Total RNA was purified and the fluorescently labeled cRNA probe was synthesized according to Affymetrix protocol for subsequent hybridization on the expression chip (MG-430A 2.0) containing 22602 probes. High-throughput data analyses were done using GeneSpring (Agilent Technologies) and MeV4 softwares. A. Box plots of gene expression patterns of indicated MEL cell lines stimulated for 24 h (X-axis; N, number of probes) identified by expression arrays (for details, see Materials and Methods and Supplementary Fig. S3A and B). Y-axis, relative expression of mRNAs relative to unstimulated cells. B. Cluster analysis of selected expression patterns (transcription factors and hallmarks of lineage differentiation) from gene expression arrays documenting the involvement of recognized lineage-specific mRNAs (for details, see Materials and Methods and Supplementary Fig. S3).

