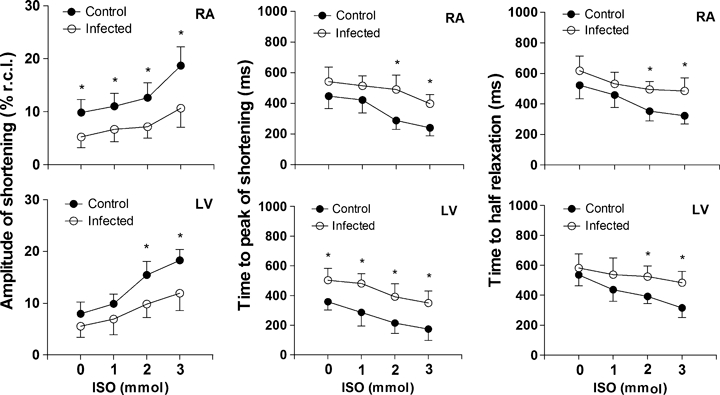
Figure 5.

Cardiomyocyte response to β-adrenergic stimulation. Cell shortening, time to peak and time to half relaxation of shortening in myocytes from the right atrium (upper panel) and left ventricle (lower panel) of control (closed circles) and infected (open circles) rats plotted vs. concentration (0–3 mmol) of isoproterenol. For each cardiac segment were analyzed 74 ± 8 cardiomyocytes. The infected animals were inoculated intraperitoneally with Trypanosoma cruzi Y strain (300,000 trypomastigotes/50 g body weight). Data of nine animals from each group were collected 9 weeks after inoculation and are expressed as mean ± SEM for the numbers of myocytes indicated from nine animals per group. Shortening is expressed as a % of resting cell length (% r.c.l.). *Denotes statistical difference from the Control in the same segment (P < 0.001).
