Figure 5.

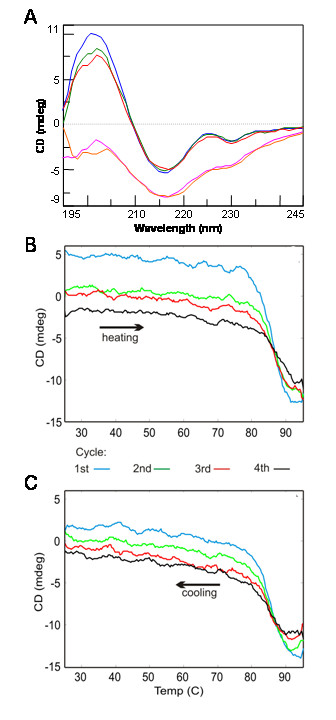
Evaluation of A3's thermal stability by monitoring secondary structure by CD. A3 was heated to 85°C and then cooled to 25°C repeatedly: A) CD spectra of A3 (blue line) and upon heating to 85°C (1st cycle, pink; 2nd cycle, orange) and upon cooling to 25°C (1st cycle, green line; 2nd cycle, red line). Alternatively, secondary structure can be monitored and Tm determined by tracking the ellipticity change at single wavelength 202 nm: B) 4 heat cycles to 95°C, first cycle blue, second cycle green, third cycle red, and fourth cycle black; C) 4 cooling cycles color coded as in panel B.
