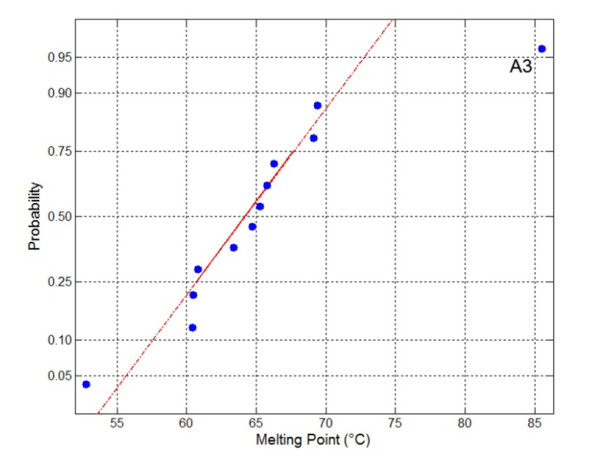
Figure 7.

The Tm of A3 deviates from a normal distribution. A total of 12 SdAb for which the melting temperatures have been determined are presented on a normal probability plot. The Y-axis values are specified by the probability distribution function for an assumed normal distribution. The straight line is a robust linear regression of the data and all data points will be near the line if the assumption is correct. The Tm for A3 can be seen to fit poorly.
