
Figure 9.
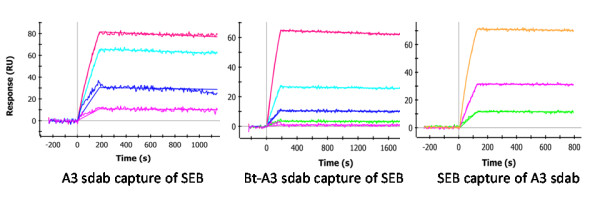
SPR binding profiles for sdAb A3. Panel A shows five concentrations of SEB (30, 10, 3.3, 1.1, and 0.37 nM) flowed for 3 minutes over immobilized sdAb A3, followed by 15 minutes dissociaiton. Data shown was corrected by subtraction of interspot data and the buffer only response. Panel B shows a similar experiment performed on a NeutrAvidin coated chip with Bt-sdAb A3 immobilized. Panel C shows sdAb A3 (30, 10, 3.3, 1.1, and 0.37 nm binding to a surface coated with SEB.