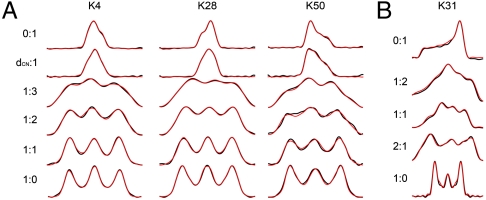
Fig. 1.
Dipolar:CST correlation spectra for both 13Cα and 15N sites. Experimental spectrum is presented in black, with simulations in red. Ratios provided are the ratio of dipolar to CST evolution. Row two of A indicates ratio of 15N-13Cα dipolar:CST evolution. (A) Fit lineshapes for [1H-13C]∶[13C CST] correlation spectra for lysines with different secondary structures are presented. K4 is located in a β-sheet, K28 in the α-helix, and K50 in a β-turn with an unusual positive value of ϕ. (b) Fit ensemble of [1H-15N]∶[15N CST] correlation spectra. Fit is representative of limited variations of 15N tensors throughout GB1.

