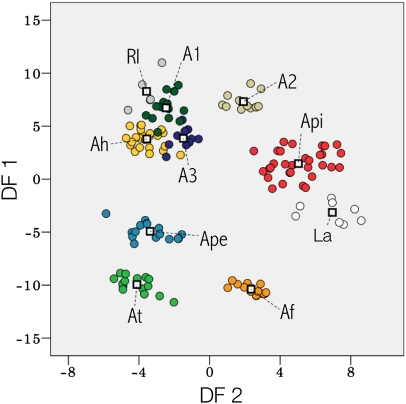
Fig. 3.
Discriminant plot summarizing between individuals’ (dots) and species’ (colors) differences in five parameters of the advertisement calls. The first discriminant function (DF1; 66.2%) is correlated with high values of low (r = 0.86), peak (r = 0.76), and high (r = 0.73) frequency, whereas the second (DF2; 25.8%) is mainly correlated with note duration (r = 0.69). The discriminant axes were switched to improve data visualization and comparison with Figs. 1 and 5. Species abbreviations are as described in Fig. 2.

