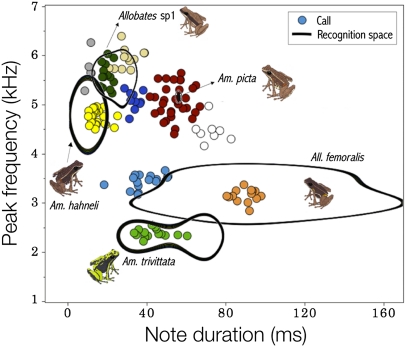
Fig. 5.
Communication space depicting the relationships between the recognition space (5 species shown) and the signal space (10 species shown) as defined by two call parameters in an assemblage of diurnal frogs. Each dot represent average values of call parameters for a single frog. The line delimitates the call parameter values at which the probability of male reaction was estimated as 0.99 by a GAM.

