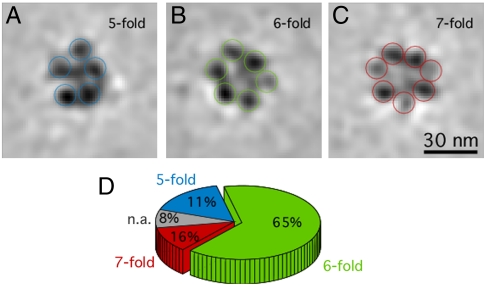
Fig. 4.
Structural variability within the dataset. A characteristic subset of the resulting subtomogram class averages from the PCA classification is shown; the slices are 1.2 nm thick. Most of the class averages display 6 nucleosomes per cross-section (B), but others show 5 (A) or 7 nucleosomes per cross-section (C), which demonstrates the level of variability with our data. The nucleosomes have varying densities because they are computationally sectioned at different heights. (D) Pie chart depicting the percentages of particles contributing to each class.

