Fig. 5.
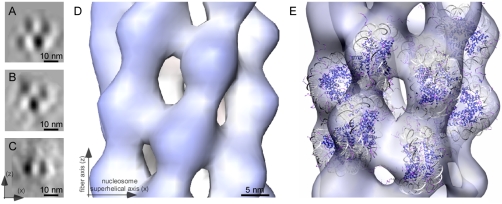
Nucleosome juxtapositioning and the idealized fiber after symmetry imposition. (A and B) Two classes from the mononucleosome classification procedure depicting a checkerboard pattern, which is completely compatible with the side views of the subtomogram average when viewed in a direction perpendicular to the fiber axis. The classes have a slightly different organization of nucleosomes, but both show nucleosomes that are juxtaposed face-to-face but shifted off their superhelical axes. The superhelical axis is parallel to the x axis. (C) A representative class from the mononucleosome classification procedure depicting a face-to-face on-axis juxtaposition of nucleosomes, which is different from that seen in the subtomogram average, which can be attributed to local distortions of the helical structure. (D) Isosurface of the idealized fiber after symmetrization based on the determined helical parameters. (E) Individual nucleosomes are fitted within the idealized fiber (visualized in the transparent white-blue isosurface). The fiber axis and nucleosome superhelical axis are indicated by arrows.

