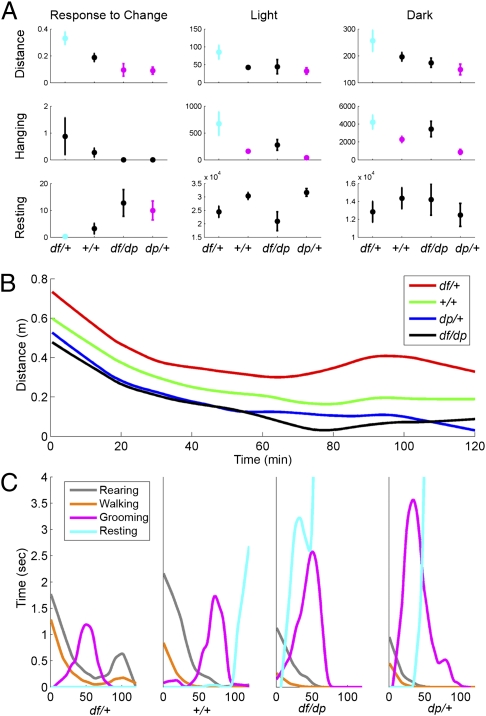
Fig. 2.
Multiple behaviors depend on 16p11.2 dosage. (A) The relationship between 16p11.2 dosage and distance traveled (Top), hanging (Middle), and resting (Bottom) is shown during the 2-h period immediately after cage transfer (Left), the light periods (Middle), and the dark periods (Right). Averages and standard error of the mean (SEM) are displayed. Statistically significant pair-wise differences relative to the df/+ group (determined by ANOVA followed by Tukey's confidence intervals) are depicted by the following: df/+ is cyan when it differs significantly from at least one other cohort, but is otherwise black; cohorts that differ significantly from df/+ are magenta, but are otherwise black. Dataset S3 shows pair-wise comparisons between genotypes. (B) Median distance traveled vs. time during the first 2 h after cage transfer. (C) Detailed behaviors during the first 2 h after cage transfer. Medians of the cumulative time of four distinct behaviors (rearing, walking, grooming, resting) vs. time elapsed from the beginning of the trial are shown for each genotype. During this period, df/+ mice do not rest; instead, they have a second peak of activity (B and C). Further information is provided in Dataset S3 and SI Experimental Procedures.

