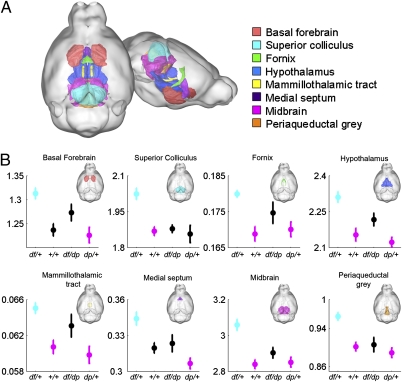
Fig. 4.
MRI identifies structural changes in brains of 16p11.2 CNV mice. The relative volume (percentage of total brain volume) of eight brain regions is increased in df/+ mice. (A) Three-dimensional representation of the mouse brain highlights eight regions (colored as in legend) affected by 16.p11.2 dosage. (B) Relative volumes (shown as percentage of total brain volume) are dependent on dosage. Mean and SEM are shown. Statistically significant pairwise differences to the df/+ group (determined by t test followed by Bonferroni–Holm procedure) are depicted as follows: cyan indicates that df/+ differs from at least one other cohort, magenta indicates cohorts that differ significantly from df/+, and black indicates groups that do not differ significantly from df/+. Full pair-wise comparisons are shown in Dataset S4.

