Fig. 5.
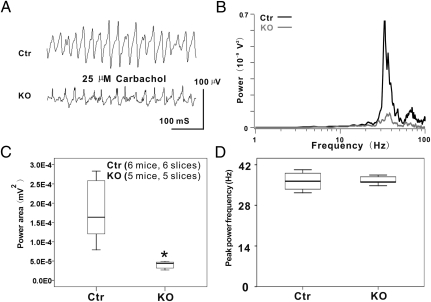
Disrupted gamma oscillations in TrkB-PV−/− mice. (A) Representative traces of network oscillations were induced by 25 μM CCh in the middle to the distal one-third of the stratum radiatum of the hippocampal CA1 slices of both Ctr and KO mice. (B) Power spectra using a fast Fourier transform algorithm indicated a remarkable reduction of network oscillations in the CA1 region of KO mice compared with Ctr. The frequency of peaks appears to be at ≈40 Hz in both Ctr and KO animals. However, the peak amplitude was significantly smaller in KO mice than in Ctr mice. The power spectrum traces were averaged from six Ctr and five KO cases. (C) Dramatic reduction of the gamma oscillation power in KO mice compared with the Ctr. (D) Lack of significant change of the oscillation peak frequency in KO mice compared with Ctr mice. *P < 0.05.

