
Figure 4.
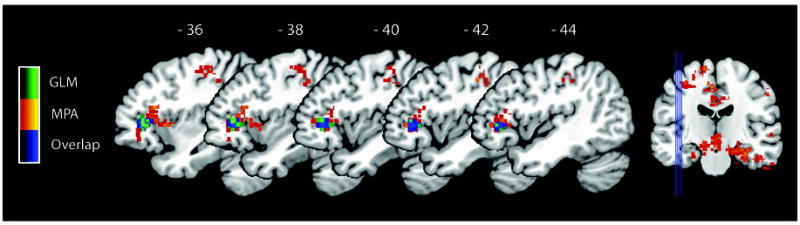
Overlap between multivariate and univariate analyses of group differences between Retrievers and Counters. Voxel-wise univariate analysis (t-test) by General Linear Modeling (GLM) showed that Retrievers had significantly greater brain activity than Counters in the left ventrolateral prefrontal cortex (VLPFC). This activation overlaps with the left VLPFC region that showed group differences using multivariate pattern analysis (MPA). As shown in legend, MPA classification results (same as in Figure 3) are in red, univariate analysis results are in green, and the overlap between the two analyses is in blue. The blue lines on the coronal slice depict sagittal slice loci.