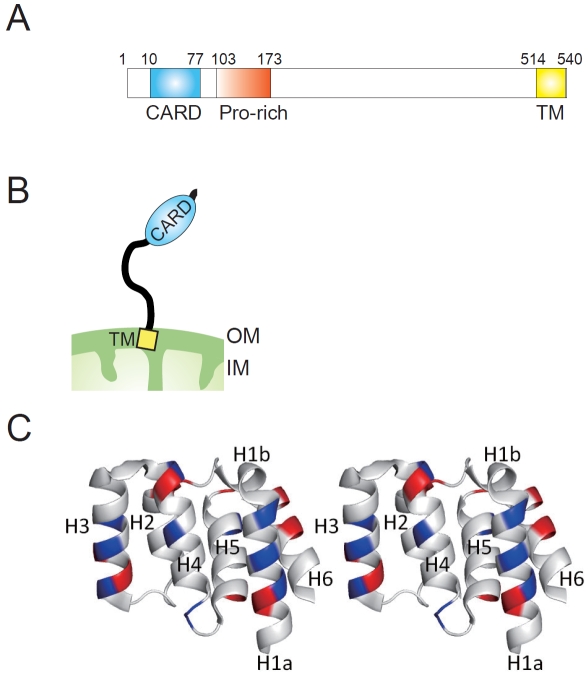
Figure 2.
MAVS structure. (A). A schematic view of human MAVS, showing the location of the CARD domain (CARD), proline-rich region (Pro-rich), and the transmembrane segment (TM). The amino acid positions are indicated above the structure. (B). Schematic representation of MAVS molecule on the mitochondrial outer membrane. OM: mitochondrial outer membrane, IM: mitochondrial inner membrane. (C). A stereo view of the CARD domain crystal structure of human MAVS [18]. Basic potentials are colored blue, and acid regions are red, respectively.

