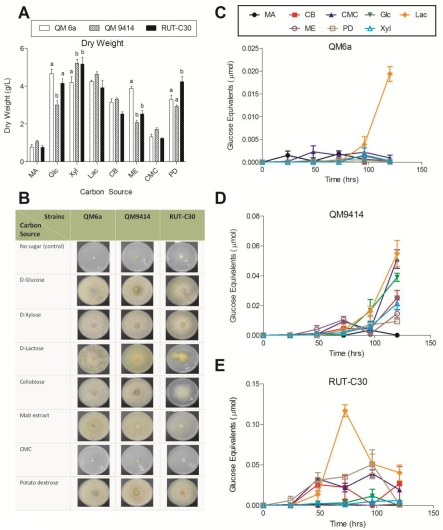
Figure 1.
Effect of the different soluble carbon sources on growth rate and total cellulase activity of the three T. reesei strains. (A) Dry weight of the T. reesei strains cultured for 5 days at 30 °C. Letters denote a significant difference between the growth rate of the strains for each carbon source (P< 0.05). Carbon sources that exhibited no significant difference between any of the strains do not have letters; (B) growth comparison of the T. reesei mutant strains QM9414 and RUT-C30 to the wild-type strain QM6a on the different soluble carbon sources after 4 days; (C) total cellulase activity of T. reesei QM6a; (D) QM9414 and (E) RUT-C30 grown on MA-medium supplemented with 1% of the different soluble carbon sources for 24-120 hrs. Error bars denote standard error of the mean.

