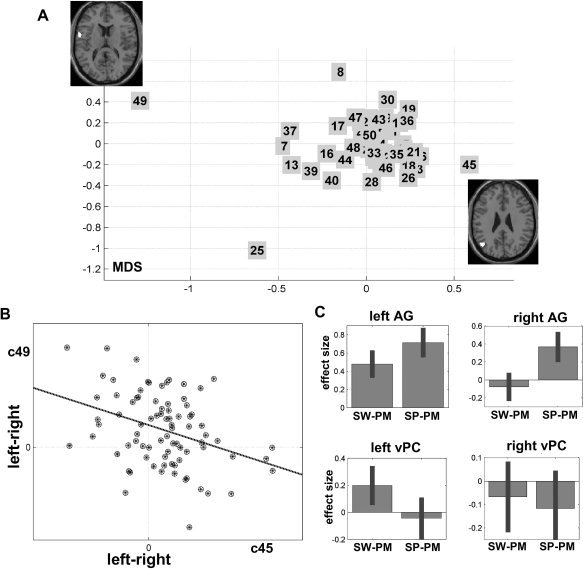
Figure 3.

A: Multidimensional scaling projection of the distance between the 50 clusters (numbered from 1 to 50). The regions belonging to the most distant clusters (clusters 45 and 49) are displayed on axial slices. B: Scatter‐plot of the negative correlation between laterality in the angular gyrus (cluster 45) and ventral precentral gyrus (cluster 49). Each subject is shown by a circle‐dot shape. C: Effect size of left and right angular and ventral precentral gyri during semantic matching on words and pictures. This displays the mean parameter estimates over all subjects that code the differences in activation signal during semantic versus perceptual matching. SW, semantic word matching; SP, semantic picture matching; PM, perceptual matching on unfamiliar stimuli.
