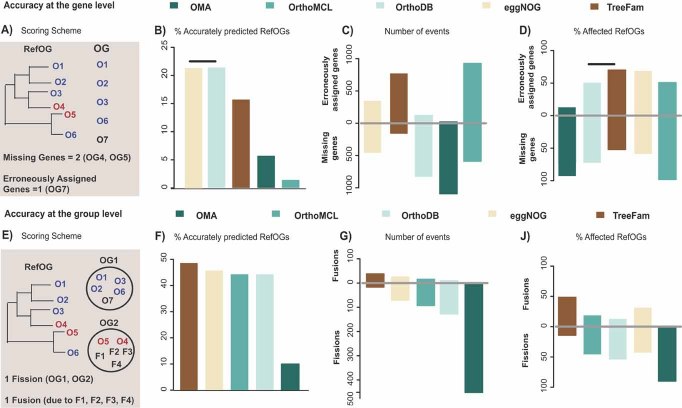
Figure 2.
The 70 manually curated RefOGs as a quality assessment tool. Five databases were used to illustrate the validating power of the benchmark set. The performance of each database was evaluated at two levels: gene (focus on mispredicted genes; upper panel) and Group (focus on fusions/fissions; lower panel) level. A: Gene count – for each database we identified the OG with the largest overlap with each RefOG and calculated how many genes were not predicted in the OG (missing genes) and how many genes were over-predicted in the OG (erroneously assigned genes) and E: group count – for each method we counted the number of OGs that members of the same RefOG have been separated (RefOG fission) and how many of those OGs include more than three erroneously assigned genes (RefOG fusion). To increase the resolution of our comparison, three different measurements for each level were provided, resulting in six different scoring schemes. B: Percentage of accurately predicted RefOGs in gene level (RefOGs with no mispredicted genes); C: number of erroneously assigned and missing genes; D: percentage of affected RefOGs by erroneously assigned and missing genes; F: percentage of accurately predicted RefOGs in grouplevel (all RefOG members belong to one OG and are not fused with any proteins); G: number of fusions and fissions; and J: percentage of affected RefOGs by fusion and fission events. Databases are aligned from the more to the less accurate, taking into account the total number of errors (length of the bar in total). Black bars indicate identical scores.

