
Figure 3.
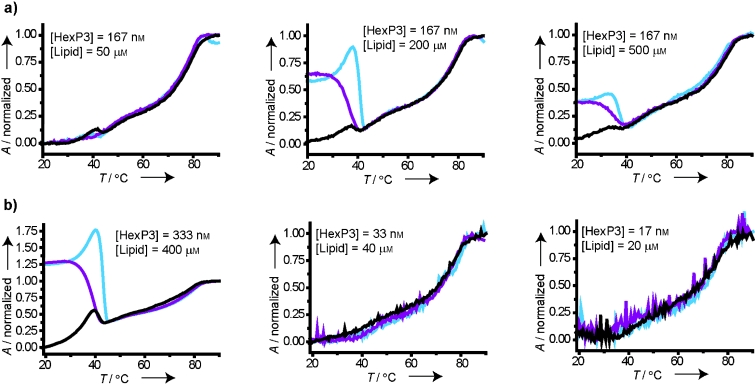
Melting curves (absorption at 260 nm (DNA) as a function of temperature) of HexP3 prehybridized in buffer whereafter liposomes were added (first temperature rise: black, temperature decrease: purple, and second temperature rise: blue). a) Melting curves with constant DNA concentration. b) Melting curves with constant DNA/liposome ratio but at different total concentrations.