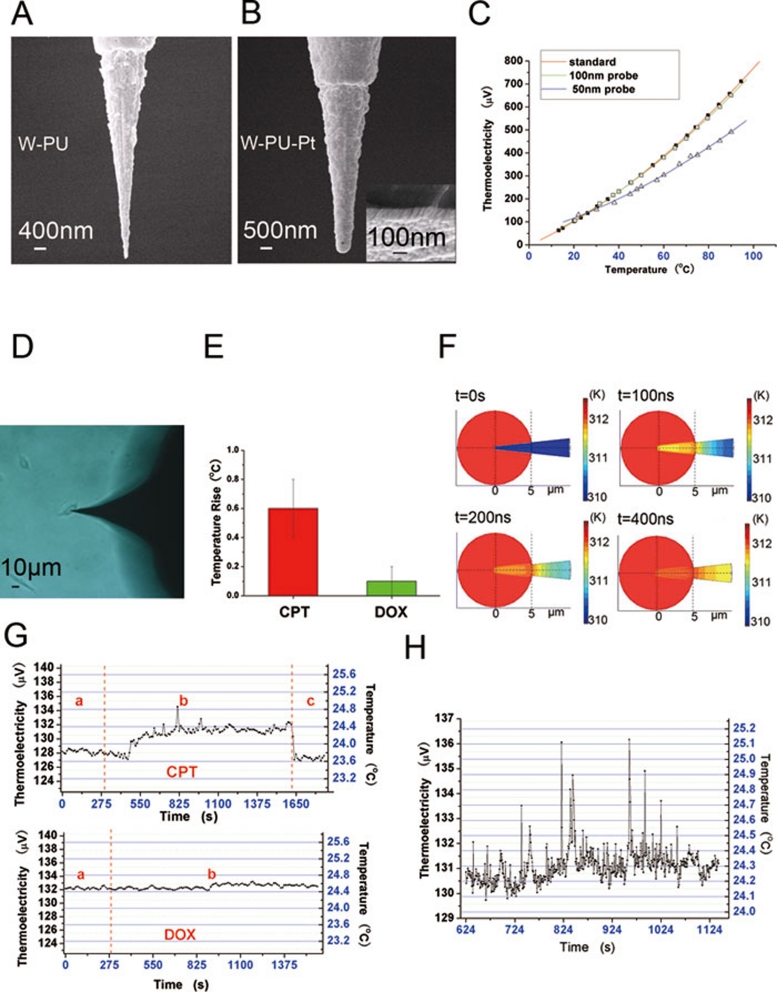
Figure 1.
(A) SEM image of tungsten probe coated by polyurethane (PU; except at the tip which is uncoated). (B) SEM image of the thin platinum film as an outermost layer. (C) Curves of the thermoelectric power from 0 °C to 90 °C. Red, green, and blue curves represent the thermoelectric power of the regular bulk W-Pt thermocouple, TC probe with 100-nm thick Pt film, and TC with 50-nm thick Pt film, respectively. (D) Optical microscopic image of a living U251 cell inserted by the TC probe. (E) A column figure indicating the average temperature changes for total cells after two drug treatment. (F) The simulated results of the TC probe response to a cell 2 °C higher than the environment. (G) Upper panel, a typical curve showing the changes of the intracellular temperature of a single U251 cell after CPT treatment. (a) TC inserted into the cell, (b) addition of CPT, and (c) TC withdrawn from the cell. Lower panel, a typical curve showing no temperature changes after addition of DOX. (a) TC inserted into the cell, and (b) addition of DOX. (H) A higher-resolution plot of part of the curve shown in (G) upper panel.

