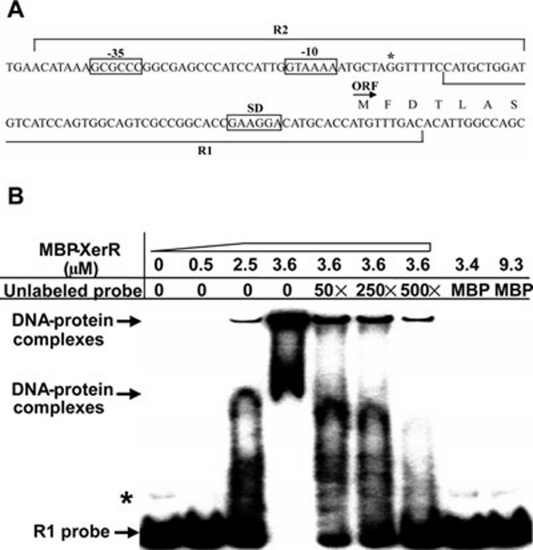
Figure 2.
EMSA shows that XerR binds to the upstream region of the xccR gene directly. (A) Schematic of the upstream region of xccR gene according to a promoter prediction program NNPP version 2.2 (1999). The putative −35/−10 and SD (Shine-Dalgarno sequence) elements are boxed, and an asterisk denotes the xccR transcriptional start site. The locations of two different probes that have a 10-bp overlap are denoted by lines. (B) EMSA assay of R1 probe with purified MBP-XerR. Isotope-labeled probe (8 fmol) was incubated for 30 min with indicated concentrations of protein (in μM) at room temperature. The shifted bands could be competed by excess of the unlabeled probe. The folds of unlabeled probe were indicated above. The migrated DNA-protein complexes and free probe R1 are indicated by arrows, and the bands marked with an asterisk indicate a possible higher structure of R1 probe formed during annealing step.

