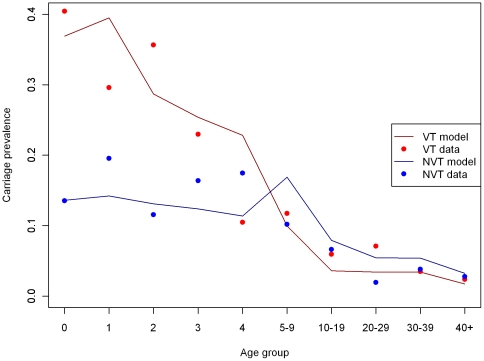
Figure 4. Carriage prevalence reported in the 2001/02 longitudinal swab study and best fitting model fitted values, stratified by serotype (VT or NVT) and 10 age groups.
The model results represent the model fitted to the point estimate for the number of adjusted IPD cases, with serotype 1 excluded. The best fitting value for the competition parameter (0.04) is assumed here.

