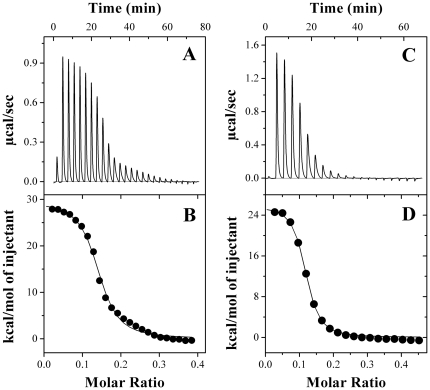
Figure 2. Calorimetric titrations for the binding of PDC-109 to DMPC membranes in the gel phase in the absence and presence of cholesterol.
ITC profiles corresponding to the binding of PDC-109 to unilamellar vesicles of DMPC (A, B) and DMPC/cholesterol (3∶1; mol/mol) (C, D) at 20°C are shown. Upper panels (A & C) show the raw data for the titration of phospholipid vesicles with protein and lower panels (B & D) show the integrated heats of binding obtained from the raw data, after subtracting the heat of dilution. The solid lines in the bottom panels represent the best curve fits to the experimental data, using the one set of sites model from MicroCal Origin. See text for further details.

