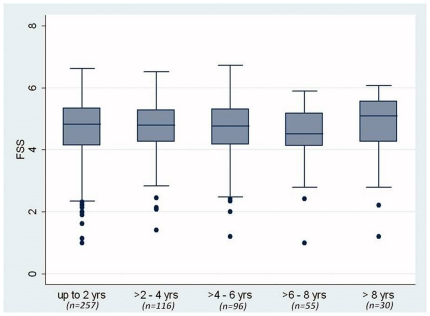
Figure 2. Course of Fatigue Severity Scale (FSS) scores over 2 year intervals of follow up time.
Data are presented in box plots. Each box represents the 25th to 75th percentile. The length of the box is the interquartile range (IQR). The line inside the box represents the median. Whiskers reprsent 1.5 times the upper and lower IQRs. Circles indicate individual outliers. N is the number of patients who had at least one FSS measurement during the time interval.

