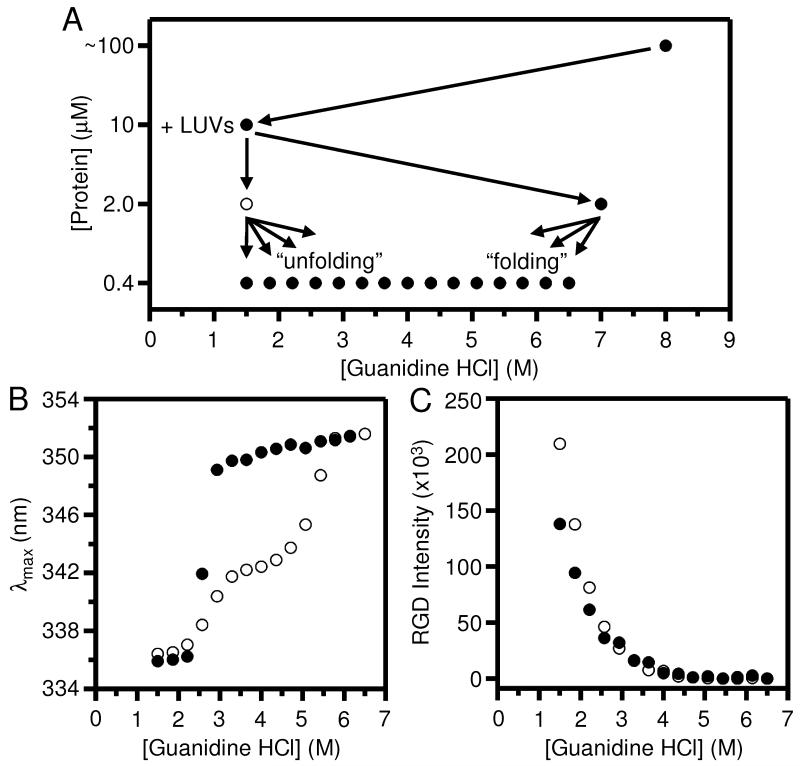
Fig. 1.
Aggregates of OmpLA that form in the presence of lipid vesicles contribute to the protein’s intrinsic fluorescence spectra during chemical denaturation titrations. The excitation wavelength for all protein fluorescence samples was 295 nm. (A) General dilution scheme for titrations of OmpLA with guanidine HCl. There were three dilution steps of the protein. The final dilution step produced the “folding” and “unfolding” titrations. (B) Wavelength position of maximum fluorescence intensity (λmax) for samples of OmpLA in folding (●) and unfolding (○) titrations with LUVs of DLPC at 37° C and at pH 8.0 after 40 hours. The titrations were prepared according to the scheme in (A). (C) Rayleigh-Gans-Debye (RGD) light scattering at 295 nm for the same folding and unfolding titrations shown in (B).

