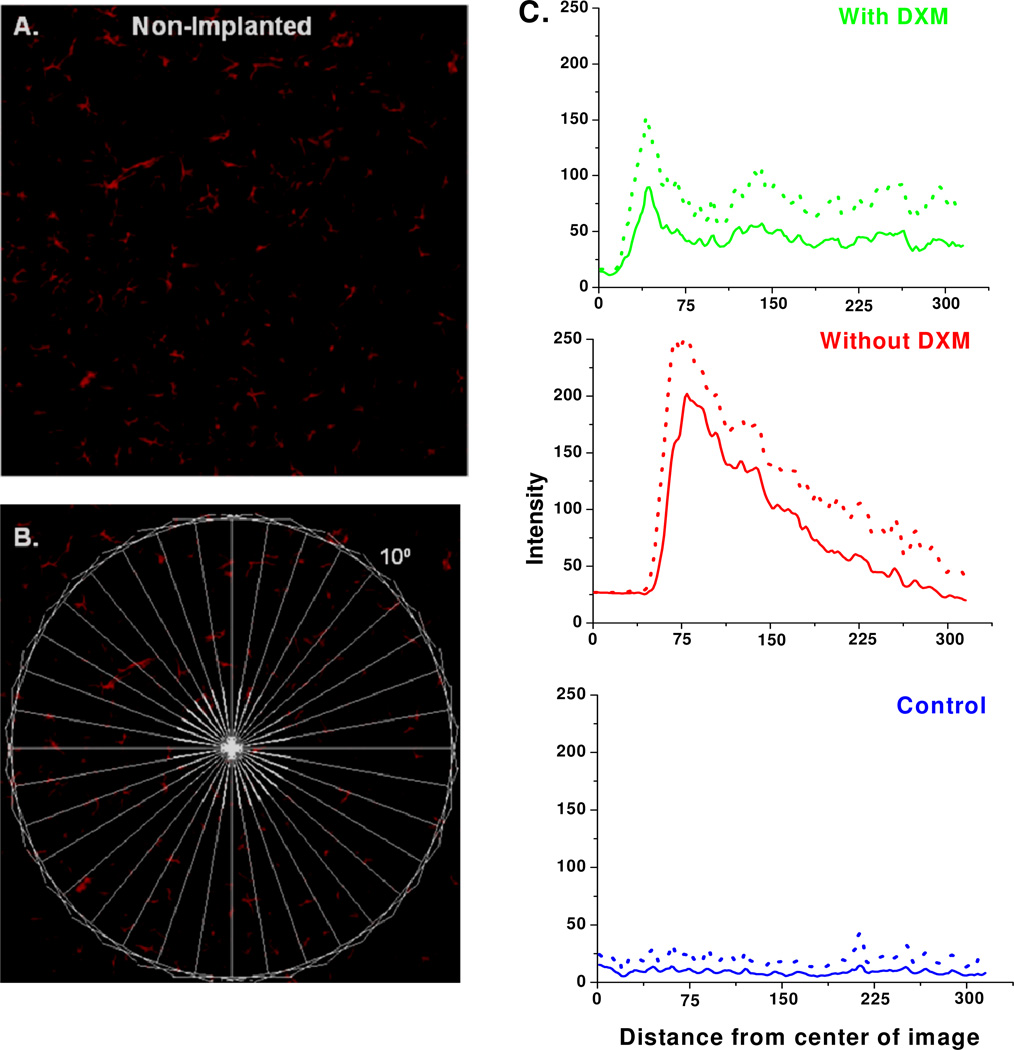
Fig. 5.
Line scan analysis of GFAP images. A) Non-Implanted control tissue. B) The same image overlaid with the spoke pattern of lines used to construct the line-scans in C. C) Line scan intensity profiles obtained from non-implanted control tissue (blue) and from tissue dialyzed without (red) and with (green) dexamethasone. Data are reported as the mean (solid line) and the standard deviation (dotted line) of 36 lines per image.

