Abstract
In this work, we have evaluated how well the General AMBER force field (GAFF) performs in studying the dynamic properties of liquids. Diffusion coefficients (D) have been predicted for 17 solvents, 5 organic compounds in aqueous solutions, 4 proteins in aqueous solutions, and 9 organic compounds in non-aqueous solutions. An efficient sampling strategy has been proposed and tested in the calculation of the diffusion coefficients of solutes in solutions. There are two major findings of this study. First of all, the diffusion coefficients of organic solutes in aqueous solution can be well predicted: the average unsigned error (AUE) and the root-mean-square error (RMSE) are 0.137 and 0.171 ×10⁻⁵ cm−2s−1, respectively. Second, although the absolute values of D cannot be predicted, good correlations have been achieved for 8 organic solvents with experimental data (R2 = 0.784), 4 proteins in aqueous solutions (R2 = 0.996) and 9 organic compounds in non-aqueous solutions (R2 = 0.834). The temperature dependent behaviors of three solvents, namely, TIP3P water, dimethyl sulfoxide (DMSO) and cyclohexane have been studied. The major MD settings, such as the sizes of simulation boxes and with/without wrapping the coordinates of MD snapshots into the primary simulation boxes have been explored. We have concluded that our sampling strategy that averaging the mean square displacement (MSD) collected in multiple short-MD simulations is efficient in predicting diffusion coefficients of solutes at infinite dilution.
Keywords: General AMBER force field (GAFF), Diffusion coefficient, Molecular dynamics simulations, Molecular property prediction
1. Introduction
This is the second paper of the paper series “Application of Molecular Dynamics Simulations in Molecular Property Calculations”. This major goal of this series is to assess the GAFF (General AMBER Force Field) in predicting various molecular properties and then to identify which force field parameters to be adjusted to reduce the prediction errors. The ultimate goal is to make GAFF a successful force field in studying the interactions between biomolecules and small organic molecules. We want to emphasize that even for a specific force field targeted to study biomolecular systems, it is also very important for it to reproduce the bulk properties of small moieties that mimic the biomolecular segments or residues. In the first paper of this series, GAFF achieves an overall satisfactory performance in calculating bulk densities and heats of vaporization of a large set of diverse molecules.1 In this work, we set out to study one of the most important dynamic properties, diffusion coefficient, D.
Accurate prediction of diffusion coefficients is not only important for developing high quality molecular mechanic force fields, but also indispensable to chemical engineering design for production, mass transfer and processing. Development of reliable methods of predicting diffusion coefficients for proteins and other macromolecules is of great interest since diffusion is involved in a number of biochemical processes, such as protein aggregation 2 and transportation in intercellular media,3,4 etc.
MD simulation is an essential technique to study a variety of molecular properties including molecular diffusion. It can study diffusion process not only in atomic details, but also under a thermodynamic condition that is unreachable by experiments. Certainly, the molecular mechanical model for MD simulations and the computation protocols must be calibrated using existing experimental data (such as diffusion coefficient) before MD is used to make a prediction. One major objective of this paper is to develop computational protocols for calculating diffusion coefficients through molecular dynamics simulations as well as to evaluate the performance of General AMBER force field in predicting the diffusion coefficients of various diffusion systems. In the following parts of the introduction, we first briefly discuss several basic concepts in molecular diffusion; then a variety of approaches of predicting diffusion coefficient are briefly reviewed.
Molecular Diffusion
Molecular diffusion describes the spread of molecules through random motion. For one molecule M in an environment where viscous force dominates, its diffusion behavior can be described by the diffusion equation in Eq. (1)
| (1) |
where is a function that describes the distribution of probability of finding M in the small vicinity of the point at time t, and D is the diffusion coefficient. Note that when the diffusion function is applied to an ensemble of M, c can be interpreted as a concentration. The diffusion equation Eq. 1 can be derived using the Fick’s first law (Eq. 2) in combination with the constraint of the conservation of particles, i.e. the flux of M into one region must be the sum of flux flowing out to the surrounding regions in normal diffusion process. Under this condition, the transport of M can be captured mathematically by the continuity equation (Eq. 3). If the diffusion coefficient D is constant in space, Eq. 3 yields to the diffusion equation (Eq. 1). The diffusion equation can also be derived from a microscopic perspective and a more general version of diffusion equation, also called Kolmogov Forward equation, can be obtained.
| (2) |
| (3) |
Diffusion equation Eq. 1 is a partial differential equation which can be solved with boundary conditions and initial condition. The diffusion equation has two important features: it is a linear equation and it is separable which means it can be split into uncoupled dimensionally independent equations. Mathematically, diffusion equation can be solved using Green’s function, which describes how a single point of probability density initially at evolves in time and space. Thus, the evolution of the system from any initial condition can be described by Eq. 4. The n-dimensional Green’s function of infinite extent is given by Eq. 5.
| (4) |
| (5) |
Given the fact that Green’s function is a probability density function, fluctuations in the position of M measured by the mean-square displacement (MSD) can be calculated with Eq. 6, which can be further simplified to Eq. 7. In this work, diffusion coefficient D will be calculated using Eq. 7 and MSD will be estimated by molecular dynamics simulations. As all the MD simulations are performed in three dimensions, therefore n = 3.
| (6) |
| (7) |
The diffusion coefficient D is related to friction coefficient ξ by Einstein-Smoluchowski equation (Eq. 8). Friction coefficient ξ depends on the sizes and shapes of molecules participating in diffusion.
| (8) |
Diffusion Coefficient Calculation by Molecular Dynamics Simulations
As discussed above, Eq. 7 is a natural result of solving diffusion equation. It is widely used in MD simulations to predict diffusion coefficient. As an alternative approach, D can also be calculated according to the Green-Kubo relation that is equal to the Einstein relation theoretically. Rather than calculate MSD, the velocity autocorrelation function is computed to calculate D using the Green-Kubo relation (Eq. 9).
| (9) |
Theoretically, diffusion coefficient D can only be accurately calculated when t→∞. In practice, one may calculate the ensemble average of MSD of multiple copies of the participating molecules in the simulation box to improve the statistics. Least-squares fitting can be applied to estimate the slope of MSD ~ t, and D is one-sixth of the slope.
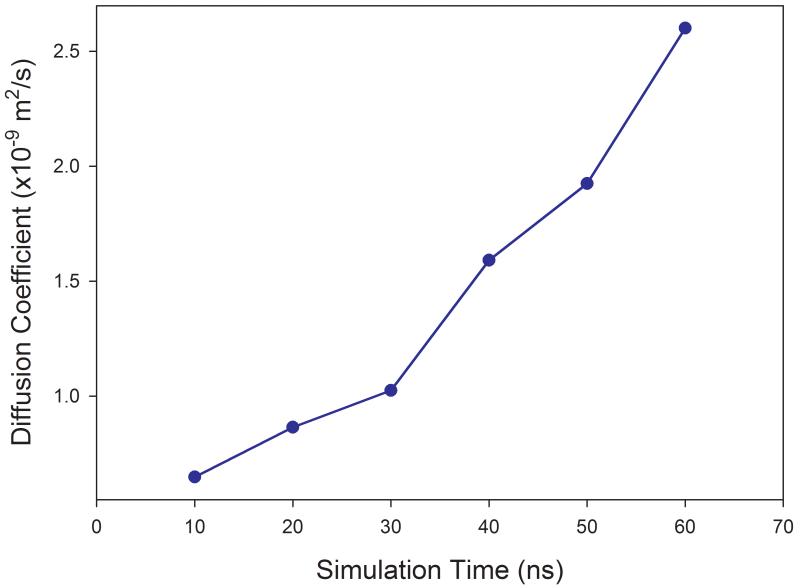
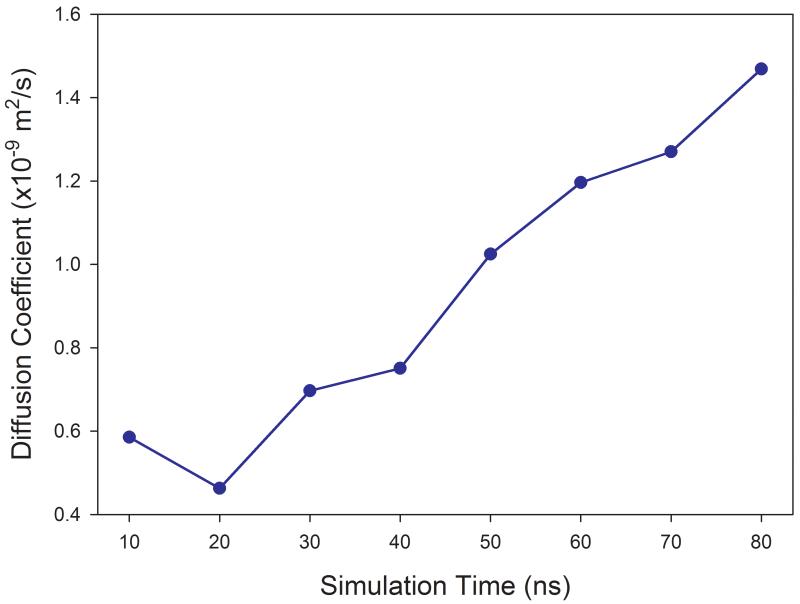
The ensemble average significantly improves the statistics, while for a single solute molecule immersed in a solvent box, much longer MD simulation is required to get a reliable diffusion coefficient. As discussed later, reliable prediction of self-diffusion coefficients of most solvents studied in this work was achieved within 3 nano seconds MD simulations using the periodic condition. However, for single solute molecules in solution, as demonstrated in Figure 1 for benzene in ethanol and phenol in water, no reliable values of diffusion coefficients can be obtained even after 60 nanoseconds for the former and 80 nanoseconds for the latter.
Figure 1.
Calculations of diffusion coefficients of solutes in solvation that need long time MD simulations. (a) benzene in ethanol solution (b) phenol in aqueous solution
Given the fact that very long MD simulations are required to get reliable results of diffusion coefficients of solutes in solution, most studies today are focused on self-diffusion coefficient calculation of solvents. Some extensively-studied solvents include water 5,6, argon,7, dimethyl sulfoxide8,9 (DMSO),10,11 methol,12 ethanol,11, N-methylacetamide (NMA),12 CCl4, CHCl3, CH2Cl2 and CHCl3, 11 and nano-colloidal particle,13 etc.
In contrast, there are only a limited number of reports on diffusion coefficient prediction of a molecule in solution using MD simulations. Harmandaris et al. performed MD simulations to calculate D for binary liquid n-alkane mixtures using the Einstein relation (Eq. 7).14 The heavier component is polymeric C78 or C60 alkane. A united-atom force field that has no electrostatic term was used to describe the molecular interactions.15 A Monte Carlo algorithm16 capable of sampling liquid polymer-oligomer mixture configuration of a variety of compositions was used to quickly equilibrate the system prior to the MD simulations. However, it is not known how successful their approach can be in studying regular solutions. Vishnyakov et al. recently studied the 1:3 mixture of DMSO-water binary system. The convergence problem mentioned above maybe not apply to their system since there are many copies of solute molecules in the simulation box.10
As to macromolecules, to the best of our knowledge, the MD-based approach has not been used to predict the diffusion coefficient of proteins in aqueous solution. The problem of convergence is more severe for proteins since the concentrations are typically very small, and usually only one protein molecule exists in a simulation box.
Other Approaches of Calculating Diffusion Coefficients
In the following, a brief review on diffusion coefficient calculation using other approaches is presented. Mantina et al. calculated D through the prediction of atomic mobility or diffusivity via a fist principle method within the framework of transition state theory. In their approach, an atomic diffusion consists of two separate processes, vacancy formation and vacancy-atom exchange. Thus, D can be written in terms of microscopic parameters, the atomic jump distance and jump frequency.17
The diffusion hydrodynamic model has been employed to interpret the temperature, density, and pressure dependencies of diffusion coefficients.18-21 The simple hydrodynamic relationship is represented by the constancy of the effective hydrodynamic radius R, which is inversely proportional to the product of the self-diffusion coefficient D and the solvent viscosity η divided by the temperature (Eq. 10). In this equation, k is the Boltzmann constant and f is a boundary condition parameter depending on the relative size of solute and solvent. When the size of solute is much larger than that of medium, f = 6 and Eq. 10 becomes the Stocks-Einstein equation.
| (10) |
Eqs. 8 and 10 are widely used to predict self-diffusion coefficients in fluids. Various empirical functions have been proposed to estimate friction coefficient ξ which is a function of density, pressure and temperature, etc.22-27 It is worth mentioning that the free-volume model and its variants are among the most successful models on D prediction. In the free volume diffusion theory, holes adjacent to a molecule must exist for a diffusion event to take place. The continuous motion of a molecule causes a variation in the size of a hole and diffusion event occurs only when the size of the hole is larger than a cutoff, Vmin. The friction coefficient is a function of Vmin and Vfree, the free volume, and the interaction potential energy between molecules. As empirical functions, a set of adjustable parameters must be fitted using experimental data. Suárez-Iglesias et al. recently evaluated a set of popular empirical equations on predicting D for a set of 120 molecules and each has more than 50 data points in average. The average percent errors ranged from 20% to 57% for those empirical functions.28
A large set of methods have been developed to predict D using statistical mechanics. Sagarik et al. employed a test-particle model that is constructed through ab initio calculations, to describe the interaction potential in the statistical mechanical simulations of liquid pyridine.29 Besides the test-particle model, a variety of empirical models have been developed to describe the molecular interaction, which include the hard sphere,30 square-well22 and Lennard-Jones models,31 etc. Diffusion coefficients can be calculated with those empirical models in combination with statistical analysis (such as statistical association fluid theory 32,33) and/or statistical mechanical simulations.29
Unlike small molecules, proteins are usually modeled as rigid bodies immersed in Newtonian solvents. As the interactions between the protein molecules are neglected, the diffusion coefficient D is therefore an infinite dilution diffusion coefficient. To predict D of a protein of an arbitrary shape, a generalized form of Eq. 10 was proposed by Brenner.34
| (11a) |
| (11b) |
Where Dt and Dr are the translational and rotational diffusion coefficients, respectively; A and B, the mobility tensors for the protein can be obtained by solving the steady-state Stokes equations. Brune and Kim proposed a computational approach to solve the Stokes equations using the double-layer boundary integral equation method.35 This approach needs 3D coordinates of a protein as input and the calculation performance is controlled by the empirical parameters, including those that control the construction of molecular surfaces. Zhao et al. recently further improved the algorithm and investigated how the calculation performance was impacted by the adjustable parameters.36 It is hard to draw solid conclusion on this method since only one protein, lysozyme, was studied in the two publications. A similar approach was applied by Gonzalez and Li to model the sequence-dependent diffusion coefficients of short DNA molecules.37 Recently, Kang and Mansfield studied the transport properties of proteins using a numerical path integration technique.38 The following transport properties can be predicted with their method: translational diffusion coefficient, intrinsic viscosity, hydrodynamic volume and radius, etc. Although the two latter properties were well predicted and a set of empirical equations of calculating D were proposed, the authors did not make a comparison of calculated D to experimental ones.
In summary, although there are a few methods for calculating diffusion coefficients, most of them depend on empirical parameters. In contrast, MD simulation belongs to a first principle approach since it does not need specific parameters for calculating D. In this study, we will propose a sampling protocol to reliably calculate D, and this computation protocol will be tested with different kinds of solutes in various solvents including proteins at infinite dilution.
2. Methods
Data Sources
In Table 1, the solute and solvent names of different liquid systems studied in this work are listed. The data set is divided into four subsets according to the types of solute and solvent, which are Set 1 – pure solvent, Set 2 – organic molecules in non-aqueous solution, Set 3 – small organic molecules in aqueous solution, and Set 4 – proteins in aqueous solution. The experimental values of diffusion coefficient are adopted from several sources.19,20,39-47
Table 1.
List of the experimental and calculated diffusion coefficients (10−9m2s−1)
| No | Solute* | Solvent | Temp (°C) (expt) |
D (expt) |
Temp (K) (MD) |
D (calc) |
R2 | Ref |
|---|---|---|---|---|---|---|---|---|
| 1 | water | water | 25 | 2.299 | 298.13 | 2.984±0.005 | 1.000±0.000 | 46 |
| 462 | NMA | NMA | 25 | 0.322 | 298.14 | 0.143±0.002 | 0.977±0.002 | 55 |
| 3 | methanol | methanol | 25 | 2.420 | 298.14 | 1.155±0.006 | 0.995±0.000 | 40 |
| 4 | benzene | benzene | 25 | 2.180 | 298.21 | 0.721±0.012 | 0.981±0.004 | 19 |
| 5 | cyclohexane | cyclohexane | 25 | 1.424 | 298.24 | 0.289±0.002 | 0.992±0.001 | 46 |
| 6 | acetic acid | acetic acid | - | - | 298.05 | 0.283±0.002 | 0.958±0.004 | |
| 7 | aceton | aceton | - | - | 298.13 | 1.321±0.005 | 0.996±0.000 | |
| 8 | acetonitrile | acetonitrile | - | - | 298.10 | 1.772±0.007 | 0.996±0.001 | |
| 9 | aniline | aniline | - | - | 298.15 | 0.122±0.007 | 0.689±0.057 | |
| 10 | CHCl3 | CHCl3 | 25 | 2.300 | 298.13 | 0.732±0.001 | 0.999±0.000 | 41 |
| 11 | CCl4 | CCl4 | 25 | 1.400 | 298.30 | 0.438±0.004 | 0.995±0.001 | 42 |
| 12 | diethylamine | diethylamine | - | - | 298.15 | 0.843±0.001 | 0.994±0.001 | |
| 13 | diethylether | diethylether | - | - | 298.20 | 1.272±0.003 | 0.998±0.000 | |
| 14 | DMSO | DMSO | 25 | 0.730 | 298.21 | 0.358±0.003 | 0.993±0.000 | 46 |
| 15 | ethanol | ethanol | 25 | 1.100 | 298.17 | 0.413±0.004 | 0.990±0.001 | 89 |
| 16 | phenol | phenol | - | - | 298.14 | 0.162±0.004 | 0.924±0.012 | |
| 17 | pyridine | pyridine | - | - | 298.06 | 0.548±0.005 | 0.983±0.001 | |
| 18 | acetic acid | aceton | 25 | 3.310 | 298.12 | 0.779±0.038 | 0.943±0.009 | 39 |
| 19 | water | aceton | 25 | 4.560 | 298.09 | 1.224±0.028 | 0.971±0.004 | 39 |
| 20 | aniline | benzene | 25 | 1.960 | 298.16 | 0.648±0.020 | 0.952±0.004 | 39 |
| 21 | ethanol | benzene | 25 | 3.020 | 298.15 | 0.805±0.024 | 0.936±0.010 | 39 |
| 22 | diethylether | CHCl3 | 25 | 2.150 | 298.13 | 0.910±0.023 | 0.986±0.003 | 39 |
| 23 | CHCl3 | CCl4 | 25 | 1.660 | 298.12 | 0.553±0.016 | 0.987±0.003 | 39 |
| 24 | benzene | cyclohexane | 25 | 1.410 | 298.13 | 0.514±0.011 | 0.982±0.003 | 39 |
| 25 | pyridine | ethanol | 25 | 1.100 | 298.13 | 0.373±0.015 | 0.970±0.007 | 39 |
| 26 | water | ethanol | 25 | 1.240 | 298.13 | 0.530±0.018 | 0.955±0.013 | 39 |
| 27 | acetic acid | water | 25 | 1.290 | 298.11 | 0.963±0.032 | 0.962±0.009 | 39 |
| 28 | acetonitrile | water | 15 | 1.260 | 288.13 | 1.333±0.045 | 0.945±0.012 | 39 |
| 29 | cyclohexane | water | 20 | 0.840 | 293.13 | 0.903±0.031 | 0.977±0.007 | 39 |
| 30 | diethylamine | water | 20 | 0.970 | 293.13 | 0.913±0.034 | 0.992±0.002 | 39 |
| 31 | phenol | water | 20 | 0.890 | 293.15 | 1.054±0.049 | 0.984±0.004 | 39 |
| 32 | 1BWI | water | 25 | 0.112 | 298.16 | 0.033±0.001 | 0.994±0.001 | 63 |
| 33 | 1EX3 | water | 25 | 0.095 | 298.15 | 0.024±0.000 | 0.994±0.001 | 63 |
| 34 | 1HRC | water | 25 | 0.130 | 298.15 | 0.040±0.001 | 0.996±0.001 | 63 |
| 35 | 1OVA | water | 25 | 0.078 | 298.16 | 0.017±0.000 | 0.981±0.003 | 63 |
NMA – N-methyl aceticamide; CHCl3 – trichloromethane; CCl4 – tetrachloromethane; DMSO – dimethyl sulfoxide
In experiments, the diffusion coefficient can be accurately measured using the conventional isotopic tracer methods.48,49 Nowadays, magnetic resonance spectroscopy (NMR) is widely used to measure the diffusion coefficients of molecules in solution. The NMR-based methods which include pulse-field-gradient NMR,46 double-gradient-spin-echo NMR,50 pulsed-gradient spin-echo NMR,19,51,52 nutation spin echo NMR,53 have some advantages over the conventional isotopic tracer methods. For instance, the NMR-based methods are faster, require smaller sample volumes, and are not influenced by interfering isotope effect, etc. Other methods include the Taylor dispersion technique, which achieves an accuracy within 1.5% in measuring diffusion coefficients.54 It is worth noting that the experimental diffusion coefficients of N-methyl acetamide (NMA, 0.322×10⁻⁹m2/s) and benzene (2.18×10⁻⁹m2/s) at 25°C are obtained through extrapolation. For NMA, there are 5 data points for temperatures ranging from 35–60°C;55 the R2 of exponential regression is 0.997. For benzene, there are 12 data points for temperatures ranging from 30–250°C;19 the R2 of exponential regression is 0.993.
On the other hand, for proteins, the diffusion coefficients are mainly determined based on Fick’s first law (Eq. 2). Those methods are usually coupled with protein separation and the following are the widely used ones: diffusion cell,56 chromatographic relaxation,57 analytical split fractionation,58 frit inlet flow field-flow fractionation,59 etc. Other techniques including pulsed-field-gradient NMR,60 interferometry,61 light scattering,62 etc. have also been used to measure the binary diffusion coefficient of proteins in aqueous solution. Four proteins, namely, Cytochrome c, lysozyme, α-chymotrypsinogen-A, and ovalbumin, were studied in this work. The experimental values of the diffusion coefficients were adopted from the CRC Handbook of Biochemistry (Ed. 2).63 The Protein Databank64 Codes of the crystal structures are listed as follows: Cytochrome c (1HRC65), lysozyme (1BWI66), α-chymotrypsinogen-A (1EX367), and ovalbumin (1OVA68).
Molecular Mechanical Models
Consistent with the strategy of parameterizing GAFF, the point charges of solute and solvent molecules in Table 1 were derived by RESP69,70 to fit the HF/6-31G* electrostatic potentials generated using the Gaussian 03 software package.71 The other force field parameters came from GAFF in the AMBER10.72 The residue topology files were prepared using the Antechamber module73 in AMBER 10.72 The cofactor, HEME in cytochrome C was first optimized at HF/6-31G* level and the RESP charges were then generated. The input structure of HEME for ab initio optimization was extracted from the crystal structure. The residue topology and force filed parameters of HEME are provided as a supplementary material. The AMBER Parm99SB force field was used to model proteins.74,75 The Leap program in AMBER10 was applied to generate the topologies.72
Molecular Dynamics Simulations
All MD simulations were performed with periodic boundary condition to produce isothermal-isobaric ensembles using the sander program of AMBER10.72 The Particle Mesh Ewald (PME) method76-78 was used to calculate the full electrostatic energy of a unit cell in a macroscopic lattice of repeating images. As to the TIP3P water which is described with a special “three-point” algorithm and all degrees of freedoms were constrained.79 All bonds were constrained using the SHAKE algorithm80 in MD simulations for the other molecules.
The integration of the equations of motion was conducted at a time step of 2 femtoseconds. Temperature was regulated using the Langevin dynamics81 with the collision frequency of 5 ps−1.82-84 Pressure regulation was achieved with isotropic position scaling and the pressure relaxation time was set to 1.0 picosecond.
There are three phases in a MD simulation, namely, the relaxation phase, the equilibrium phase and the sampling phase. In the relaxation phase, the main chain atoms were gradually relaxed by applying a series of restraints and the force constants decreased progressively: from 20 to 10, 5 and 1.0 kcal/mol/Å2. For each force constant, the position-restrained MD simulation was run for 20 picoseconds. In the following equilibrium phase, the system was further equilibrated for 5 nanoseconds without any restraint and constraint. In the sampling phase, if not mentioned explicitly, 1500 snapshots were saved at an interval of 2 picoseconds for post analysis. For TIP3P water, 2500 snapshots were saved at an interval of 2 picoseconds after the 2 nanoseconds equilibrium phase. The mean-square displacements (MSD) were calculated using the Ptraj module of AMBER10.72
Self-Diffusion Coefficient Calculations of Solvents
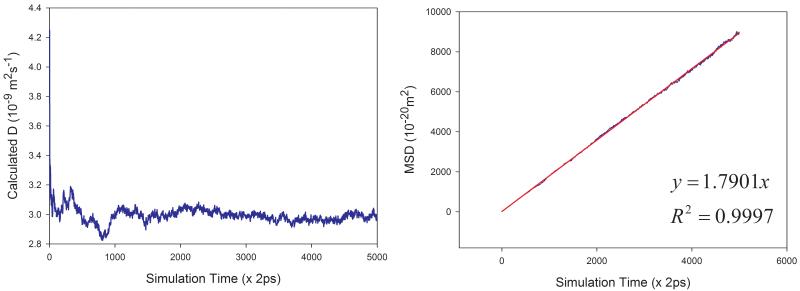
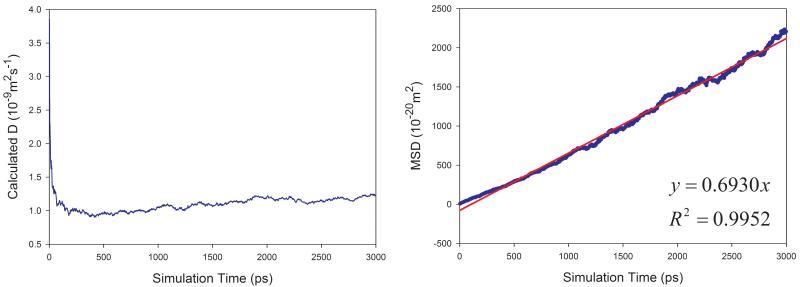
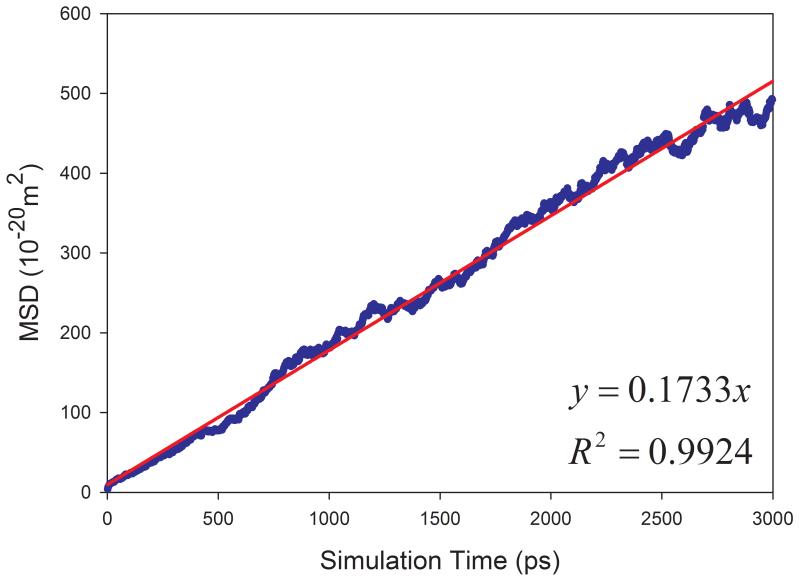
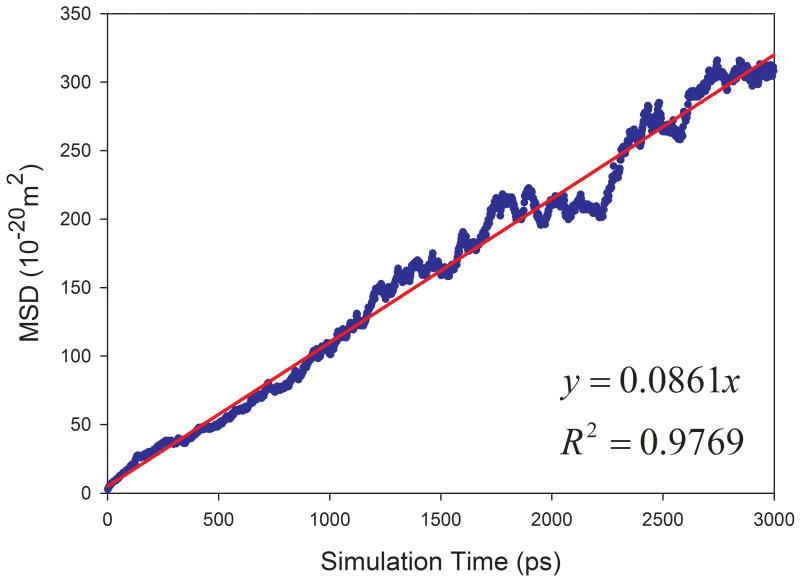
Eq. 7 was used to calculate the diffusion coefficient D in this work. For a pure solvent, the mean square displacements (MSD) were averaged for all the solvent molecules in the simulation box. D can then be estimated from the plot of mean MSD ~ simulation time as illustrated in Figure 2 (left panels). D can be more objectively predicted through least-square fittings. As shown in Figure 2, good correlations are achieved for TIP3P water and methanol at 298 K. The slopes are 1.7901 and 0.6930, for TIP3P and methanol, respectively. The calculated diffusion coefficients are then 2.98 and 1.16 ×10⁻⁹ m2s−1 for TIP3P and methanol, respectively.
Figure 2.
Prediction of diffusion coefficients of two solvents using the slope of mean square displacements (MSD) ~ simulation time plot. (a) TIP3P water at 298 K and (b) methanol at 298 K. Left panel: calculated D ~ simulation time plot; right panel: correlation between MSD and simulation time.
Diffusion Coefficient of Solute in Solution
We emphasized that the diffusion coefficient of a solute at infinite dilution cannot be reliably calculated when MD simulations are short. As demonstrated in Figure 1, the D of benzene in ethanol and phenol in water solutions are not converged even after 60 and 80 nanoseconds MD simulations. Therefore, it is critical to develop a practical sampling strategy to reliably calculate D of solute at infinite dilution. Here we propose to perform 20 independent MD sampling runs using the same starting coordinates; then the mean MSD are calculated by running average of MSD of 20 trajectories; and the diffusion coefficient D is finally estimated by a least-square fitting of mean MSD ~ simulation time. Even though the same starting conformation is applied, the independence of 20 MD runs was achieved by using different random seeds (1575, 18941, 30702, 28852, 8606, 32218, 6763, 22185, 9686, 23608, 4576, 27757, 12734, 31952, 19092, 10400, 25433, 27184, 9312, 30073) to generate initial velocities.
Statistical Uncertainty Estimation
Different protocols were used to estimate the uncertainty of diffusion coefficient prediction through MD simulations. For self-diffusion coefficient of pure solvent, the uncertainty was estimated by the RMS deviation of a series of diffusion coefficients D, which were calculated using the MSD of the first 1000, 1025, 1050, 1075, 1100… 1500 snapshots. On the other hand, for the solutes in solutions, a leave-one-out (LOO) strategy was used to estimate the uncertainty of D. Specifically, for the 20 independent MD runs, one is excluded in turn and the other 19 MD runs are used to calculate D; the RMS deviation of the 20 diffusion coefficients measures the uncertainty of the D for solutes in solutions.
3. Results and Discussion
Diffusion coefficient D is one of the most important properties to be calibrated in molecular mechanical force field development. Other dynamic property, such as orientational correlation time – τrot, can be calculated using the orientational correction function – Grot(t) obtained through MD simulations.11 Unlike other molecular properties, such as bulk density and heat of vaporization, diffusion coefficient D typically has larger measurement errors. In the following, we cherry pick several solvents/solutes that have multiple measurements to demonstrate how different the experimental values could be. There are three measurements for trichloromethane: 2.3,41 2.5,85 3.386; two measurements for tetrachloromethane: 1.4,42 1.387; three for DMSO: 1.1,43 0.8,88 0.7346; two for ethanol: 1.5,44 1.189, two for benzene in cyclohexane: 1.41,39 1.9290, five measurements for cytochrome C: 0.130,63 0.118,58 0.1363,59 0.1386,59 and 0.127.59 All the numbers are in 10−9m2/s.
Considering the striking differences among the 35 liquid systems studied in this work, we classified the 35 liquid systems into four groups, namely, pure solvent, organic solute in organic solution, organic solutes in aqueous solution and proteins in aqueous solution. In the following, we will present the calculation results for the four types of liquid systems sequentially.
Self-Diffusion Coefficient of Pure Solvents
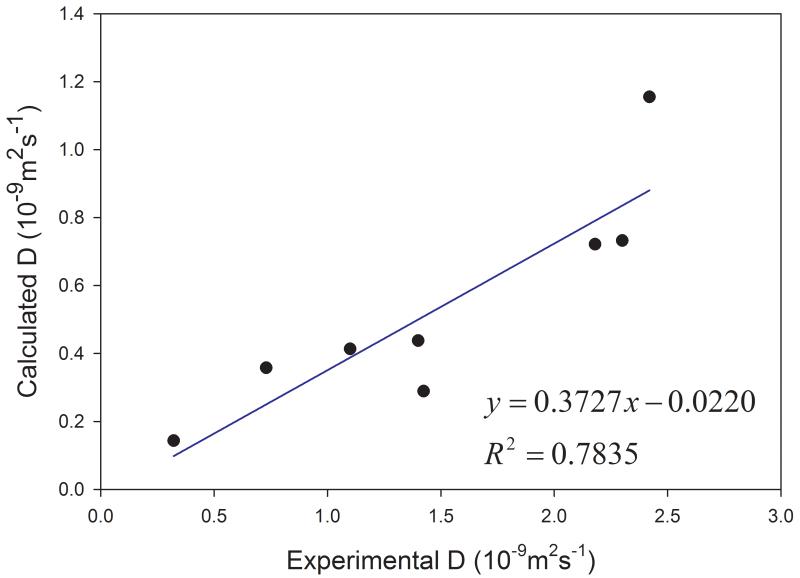
Among the 17 solvents studied in this work, 9 have experimental diffusion coefficients. Interestingly, all the calculated self-diffusion coefficients of nine solvents except TIP3P water are somewhat underestimated. For TIP3P water, the calculated D at 298 K is overestimated about 30%. Although the calculated diffusion coefficients of 8 organic solvents are much smaller than the experimental ones, a good correlation between the experimental and the calculated D is found as shown in Figure 3. The correlation coefficient square R2 is 0.7835.
Figure 3.
Correlation between calculated and experimental diffusion coefficients for the organic solvents
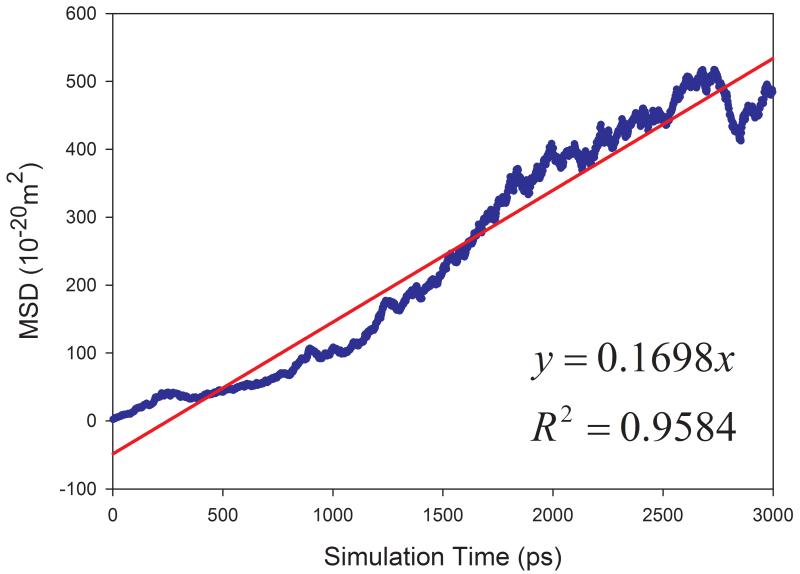
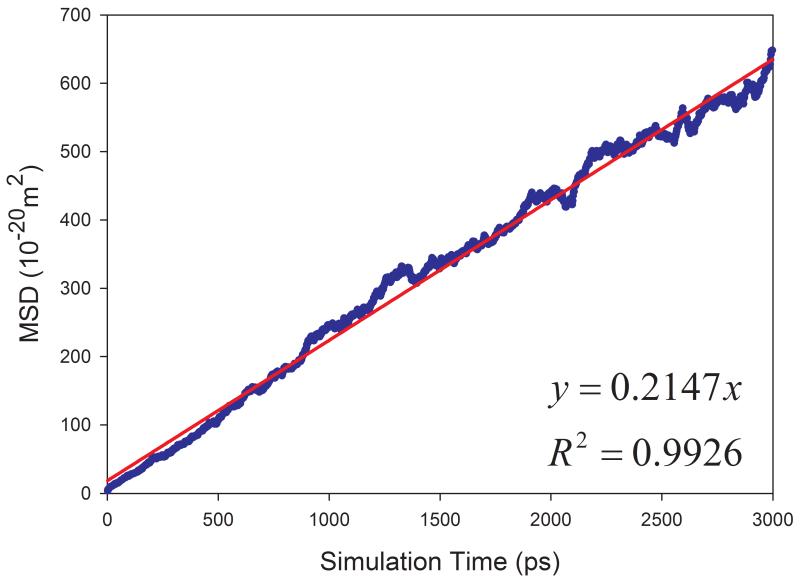
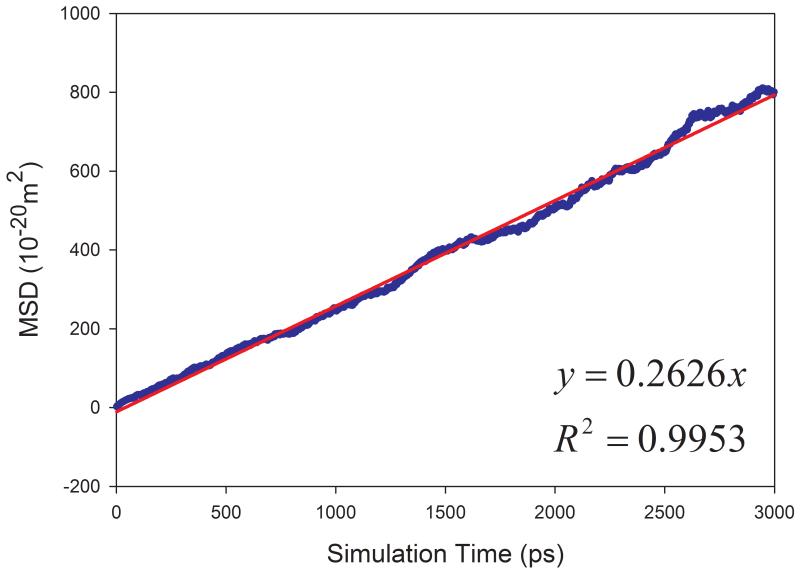
The calculated diffusion coefficients and the correlation coefficients R2 of fitting MSD versus simulation times are listed in Table 1. Encouragingly, most solvents have R2 better than 0.95 except for aniline and phenol, which have R2 of 0.689 and 0.924, respectively. The fitting performance of five representative solvents is shown in Figure 4. The much smaller R2 for aniline solvent implies that a longer MD simulation is needed to achieve better statistics. Indeed, after we continued to run another 10 nanoseconds MD simulations for aniline and phenol, we significantly improved the fitting performance: R2 and calculated D are 0.838 and 0.128 ×10⁻⁹ m2s−1 for aniline, and 0.972 and 0.265 ×10⁻⁹ m2s−1 for phenol, respectively.
Figure 4.
Correlation between mean squared displacement (MSD) and simulation time for representing solvents. (a) acetic acid, (b) DMSO, (c) CCl4, (d) cyclohexane, (e) NMA.
Temperature Dependence of Self-Diffusion of Solvents
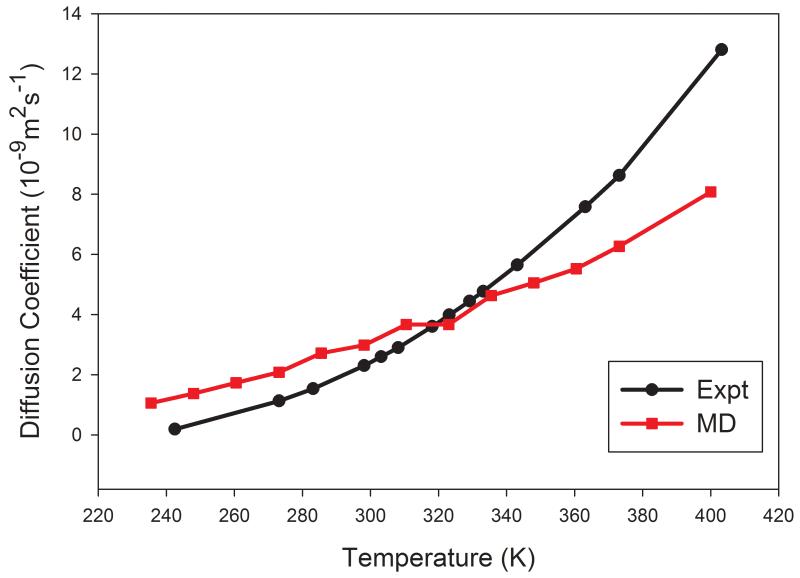
It is important for a molecular mechanical model to accurately predict molecular properties of a broad range of thermodynamic states described by temperature, volume, pressure, etc. Here the temperature dependence of three solvents, namely, TIP3P water, cyclohexane and DMSO, was studied in this work. As shown in Figure 5, the calculated diffusion coefficients of TIP3P decrease more slowly than the experimental values and the two lines cross around 320 – 340 K. When temperature is lower than 320 K, D is overestimated; while D is underestimated when temperature is higher than 340 K. Good prediction performance is achieved for temperatures ranging from 320 to 340 K.
Figure 5.
The temperature dependence of diffusion coefficient of TIP3P water
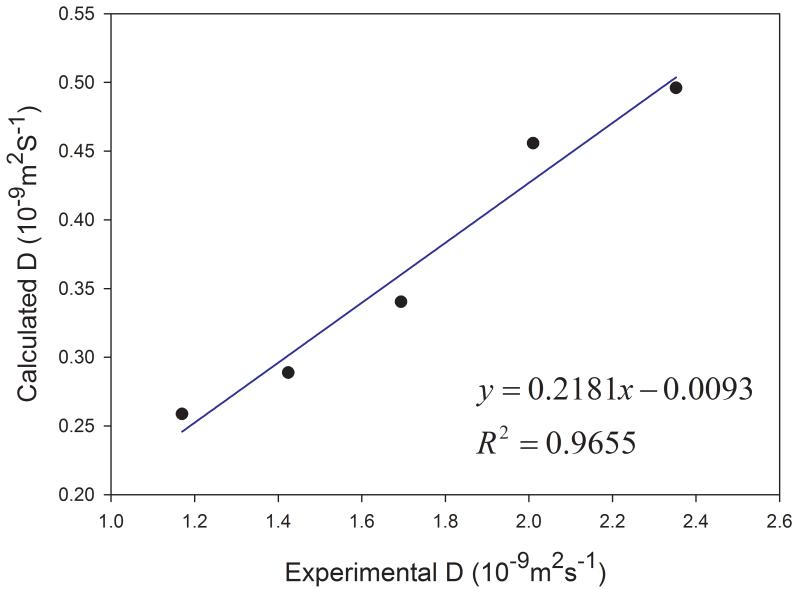
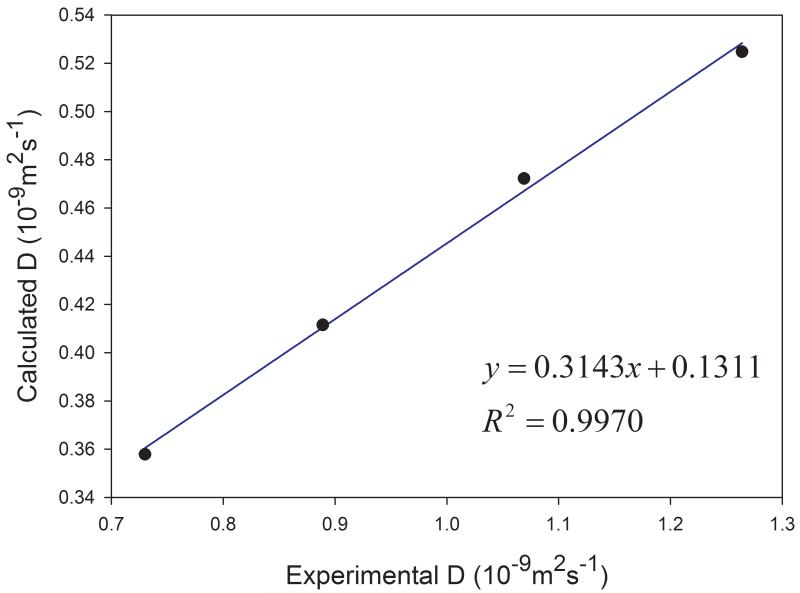
Similar to other organic solvents, the diffusion coefficients of cyclohexane and DMSO at different temperatures are underestimated. However, good correlations are observed between the calculated and the experimental data at various temperatures for both solvents (Figure 6). The correlation coefficient squares are 0.966 and 0.977 for cyclohexane and DMSO, respectively. The experimental and calculated data used for plotting Figures 5 and 6 are listed in Table 2.
Figure 6.
Performance of predicting diffusion coefficients at different temperatures for (a) cyclohexane and (b) DMSO
Table 2.
List of the experimental and calculated diffusion coefficients (10−9m2s−1) for three solvent at various temperatures
| No | Solvent* | Temp (expt) |
D (expt) |
Temp (MD) |
D (calc) |
R2 | Ref |
|---|---|---|---|---|---|---|---|
| 1 | water | 235.50 | - | 235.47 | 1.059±0.001 | 0.999±0.000 | |
| 2 | water | 242.50 | 0.1870 | 47 | |||
| 3 | water | 248.00 | - | 247.96 | 1.374±0.001 | 0.999±0.000 | |
| 4 | water | 260.50 | - | 260.49 | 1.734±0.009 | 0.998±0.000 | |
| 5 | water | 273.15 | 1.1290 | 273.16 | 2.085±0.014 | 0.998±0.000 | 45 |
| 6 | water | 283.15 | 1.5360 | 45 | |||
| 7 | water | 285.50 | 285.49 | 2.717±0.020 | 0.998±0.000 | ||
| 8 | water | 298.15 | 2.2990 | 298.13 | 2.984±0.005 | 1.000±0.000 | 46 |
| 9 | water | 303.15 | 2.5970 | 46 | |||
| 10 | water | 308.15 | 2.8950 | 46 | |||
| 11 | water | 310.50 | 310.45 | 3.667±0.016 | 0.999±0.000 | ||
| 12 | water | 318.15 | 3.6010 | 46 | |||
| 13 | water | 323.00 | 322.85 | 3.667±0.012 | 0.999±0.000 | ||
| 14 | water | 323.15 | 3.9830 | 46 | |||
| 15 | water | 329.15 | 4.4440 | 46 | |||
| 16 | water | 333.15 | 4.7720 | 45 | |||
| 17 | water | 335.50 | 335.42 | 4.629±0.008 | 0.999±0.000 | ||
| 18 | water | 343.15 | 5.6460 | 45 | |||
| 19 | water | 348.00 | 347.87 | 5.056±0.014 | 1.000±0.000 | ||
| 20 | water | 360.50 | 360.43 | 5.527±0.014 | 0.999±0.000 | ||
| 21 | water | 363.15 | 7.5780 | 45 | |||
| 22 | water | 373.15 | 8.6230 | 373.04 | 6.268±0.007 | 1.000±0.000 | 45 |
| 23 | water | 400.00 | 400.00 | 8.073±0.056 | 0.999±0.000 | ||
| 24 | water | 403.20 | 12.8000 | 20 | |||
| 25 | cyclohexane | 288.15 | 1.1700 | 288.15 | 0.259±0.002 | 0.991±0.001 | 46 |
| 26 | cyclohexane | 298.15 | 1.4240 | 298.24 | 0.289±0.002 | 0.992±0.001 | 46 |
| 27 | cyclohexane | 308.15 | 1.6940 | 308.15 | 0.340±0.003 | 0.992±0.001 | 46 |
| 28 | cyclohexane | 318.15 | 2.0100 | 318.16 | 0.456±0.001 | 0.995±0.000 | 46 |
| 29 | cyclohexane | 328.15 | 2.3520 | 328.17 | 0.496±0.005 | 0.991±0.000 | 46 |
| 30 | DMSO | 298.15 | 0.7300 | 298.21 | 0.358±0.003 | 0.993±0.000 | 46 |
| 31 | DMSO | 308.15 | 0.8890 | 308.12 | 0.412±0.003 | 0.994±0.001 | 46 |
| 32 | DMSO | 318.15 | 1.0690 | 318.16 | 0.472±0.006 | 0.989±0.002 | 46 |
| 33 | DMSO | 328.15 | 1.2640 | 328.11 | 0.525±0.001 | 0.997±0.000 | 46 |
DMSO – dimethyl sulfoxide
Diffusion Coefficients of Organic Solutes in Organic Solution
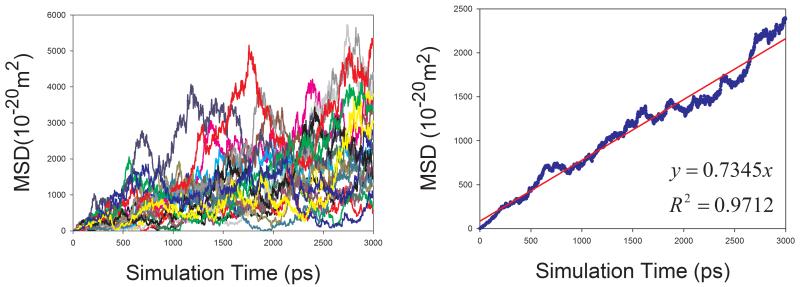
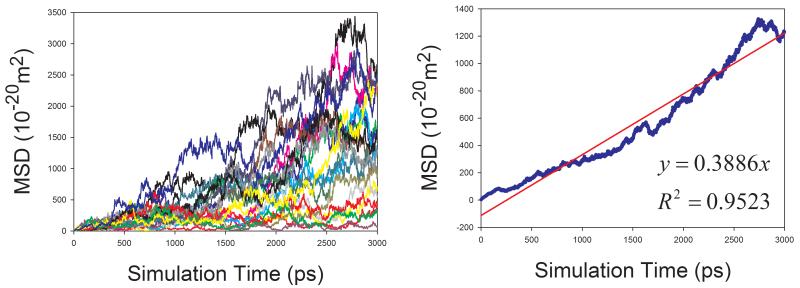
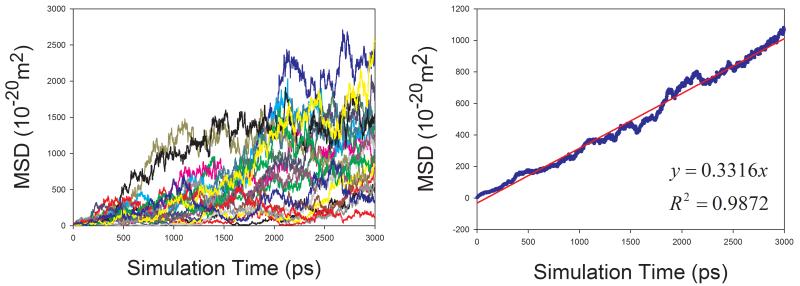
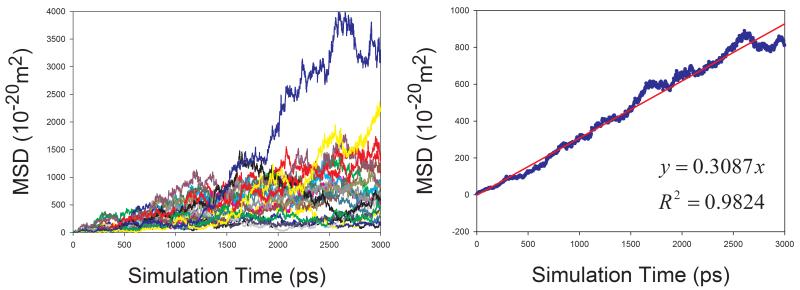
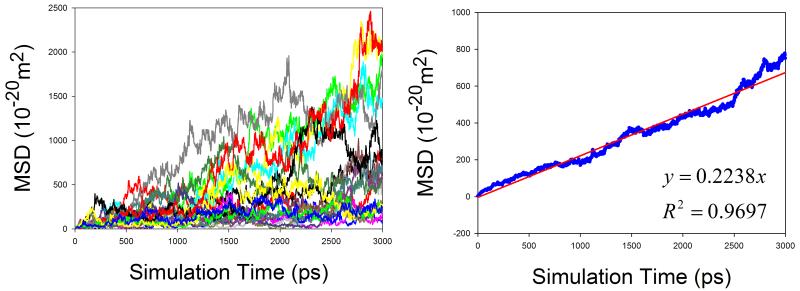
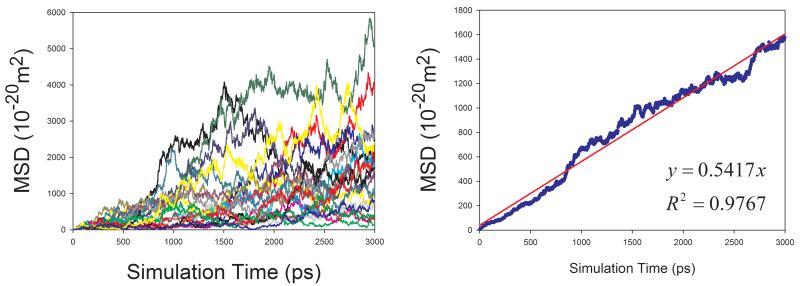
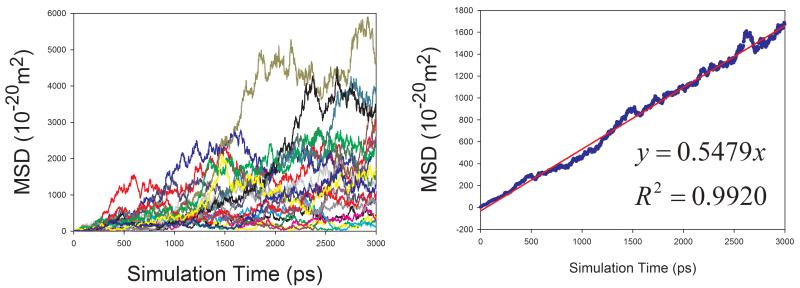
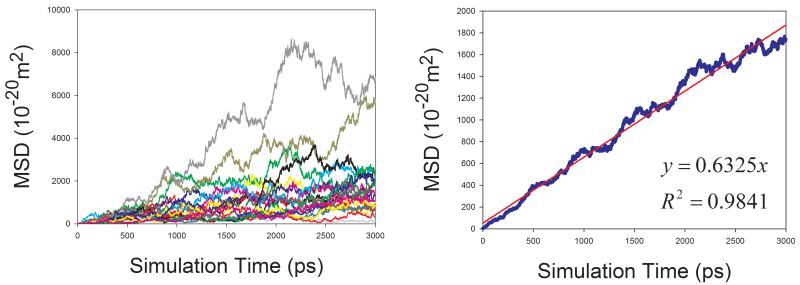
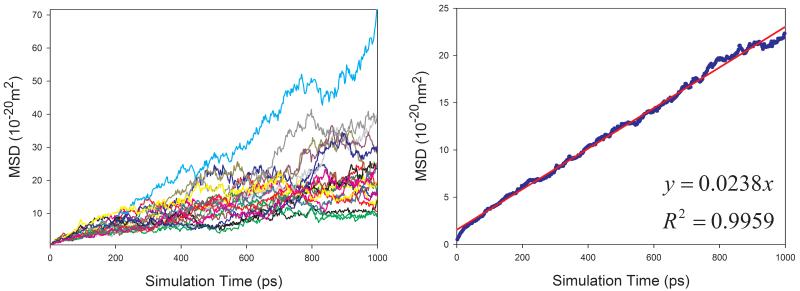
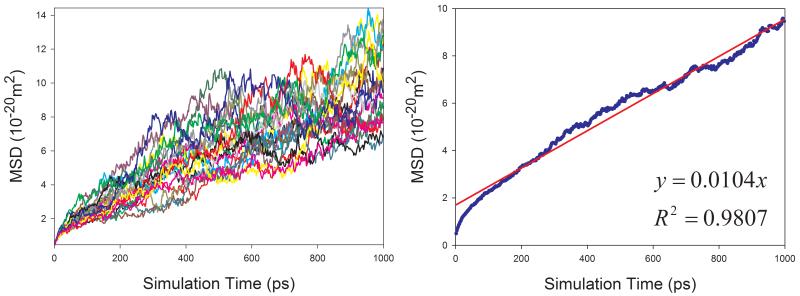
In total, 9 organic solutions were studied in this work. To improve the statistics and shorten the MD simulation time, the strategy of “averaging MSD of multiple independent MD runs” was applied to calculate the diffusion coefficients for solutes. As demonstrated by Figure 7, this strategy profoundly improves the statistics of diffusion coefficient calculations. The left panels of Figure 7 show the MSD ~ simulation time plots of 20 independent MD runs. It is obvious that the linearity of MSD ~ time of an individual MD run is poor and diffusion coefficient D cannot be reliably predicted. When we average multiple MSD, the linearity of mean MSD ~ simulation time is significantly improved and D can be reliably predicted (right panels of Figure 7).
Figure 7.
Calculations of diffusion coefficients for organic solutes in solutions using the strategy of averaging MSD of multiple independent MD runs. Left panel: MSD ~ simulation time plots for 20 MD runs; right panel: correlation between mean MSD ~ simulation time. (a) water in acetone, (b) aniline in benzene, (c) CHCl3 in CCl4, (d) benzene in cyclohexane, (e) pyridine in ethanol, (f) cyclohexane in water, (g) diethylamine in water, and (h) phenol in water
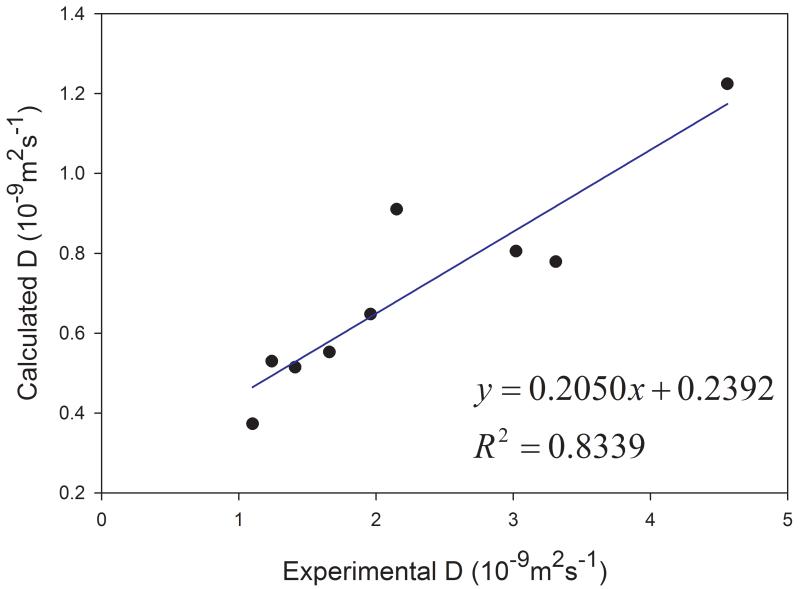
Similar to organic solvents, the diffusion coefficients of solutes are also underestimated (Table 1). Nevertheless, good correlation between the calculated and the experimental D is achieved and the correlation coefficient square is 0.834 (Figure 8).
Figure 8.
Correlations between the calculated and the experimental diffusion coefficients of nine solutes in organic solvents
Diffusion Coefficients of Organic Solutes in Aqueous Solution
The diffusion coefficients of five organic molecules in aqueous solution were studied. Interestingly, for all the five solutes, good performance of calculating diffusion coefficients is achieved: the AUE, RMSE and APE are 0.137, 0.171 ×10⁻⁹m2s−1 and 12.6%, respectively. Given the fact the experimental error of measuring diffusion coefficient can be larger than 0.5, our prediction of D for small organic molecules in aqueous solution is satisfactory. How the sampling strategy improves the statistics is demonstrated in Figure 7f, 7g and 7h.
Diffusion Coefficients of Proteins in Aqueous Solution
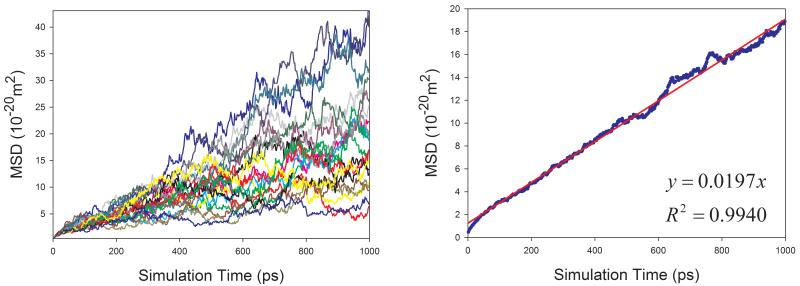
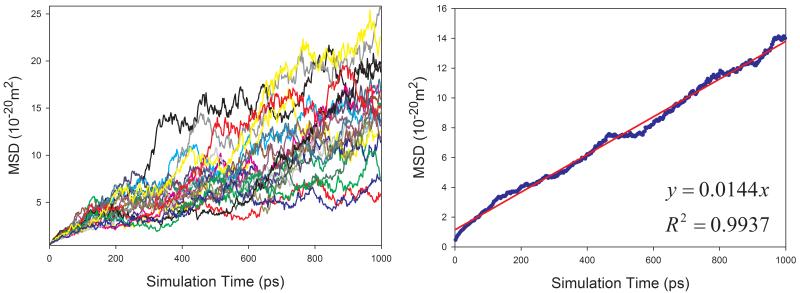
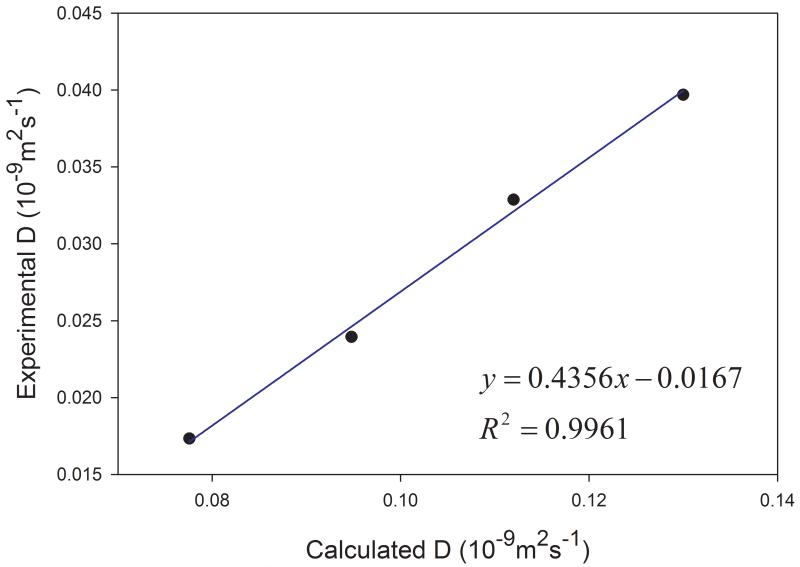
Given the fact that the publicly available experimental data of diffusion coefficients for proteins are scarce, we selected four proteins with varying sizes (from 106 to 386 amino acid residues) to assess how our calculation protocol performs for proteins. Similar to organic solutes, the diffusion coefficients of proteins cannot be reliably calculated because of poor linearity between MSD and simulation time for individual MD runs. As shown in Figure 9, the above-mentioned sampling strategy also significantly improves the reliability of calculating D for proteins. Though the calculated diffusion coefficients of proteins are all underestimated as shown in Figure 10, a very good correlation between the calculated and the experimental values is achieved and the correlation coefficient square is 0.996.
Figure 9.
Calculations of diffusion coefficients for proteins in aqueous solution using the strategy of averaging MSD of multiple independent MD runs. Left panel: MSD ~ simulation time plots for 20 MD runs; right panel: correlation between mean MSD ~ simulation time. (a) 1BWI, (b) 1EX3, (c) 1HRC, and (d) 1OVA
Figure 10.
Correlations between the calculated and the experimental diffusion coefficients of four proteins
Interpretation of the observation in diffusion coefficient calculations
In summary, good prediction performance of D is achieved for small organic molecules in aqueous solution. Although the diffusion coefficients of organic solutes in organic solutions, proteins in aqueous solution as well as organic solvents are underestimated, good correlations are achieved between the calculated and the experimental data for the all of the three solution types. How can we interpret this observation? Why diffusion coefficients are significantly underestimated for organic solutes in organic solvents? Why diffusion coefficients are underestimated for proteins but well predicted for organic small molecules in aqueous solution? Here we attempt to rationalize the prediction results from the concept of diffusion. Molecules move at random because of frequent collisions and molecular diffusion is propelled by thermal energy. In a solution, the thermal energy comes from not only collisions between solute and solute, but also collisions between solute and solvent. Therefore, when solvent molecules move faster, more solute-solvent collisions occur and then more thermal energy is generated to propel the motion of solute molecules, resulting in a larger diffusion coefficient. As discussed above, the self-diffusion coefficients of TIP3P is overestimated and those of organic solvents are underestimated. Therefore, TIP3P water can boost the diffusion of its solutes while other organic solvents slow down the diffusion of their solutes. For organic solutes in aqueous solution, the slowing diffusive organic solutes are boosted by the TIP3P water and the net result is that D can be well predicted; for organic solutes in organic solvents, the slowing diffusive organic solutes are further slowed down by the organic solvents resulting in a much smaller slope of calculated versus experimental D plot (Figure 8) than that of pure solvent (Figure 3). As to proteins in aqueous solution, the TIP3P water has much smaller effect on the diffusion of a protein than on the diffusion of an organic solute, because in a simulation box the number of solute atoms to the number of solvent atoms ratio is much smaller for a protein than for an organic molecule. Specifically the ratios are 11, 11, 7 and 8 for 1BWI, 1HRC, 1EX3 and 1OVA, respectively; on the contrary, the ratios of organic molecules are much larger (> 150). Therefore, the diffusion coefficients of proteins are still somewhat underestimated. However, the slope of the calculated versus experimental diffusion coefficient plot for proteins (Figure 10) is larger than those for pure solvent and organic solutes in organic solvents.
Although the above rational can qualitatively explain the rank order of the slopes of different diffusion systems, it also has limitations. First of all, the rationalization does not address the actual causes of under or overestimation of diffusion coefficients; secondly, it may fail to rationalize the trend of the diffusion coefficients of particular solutes in aqueous and organic solutions.
The Major Factors That Affect Diffusion Coefficient Calculations
As discussed above, GAFF achieves an overall satisfactory performance in predicting diffusion coefficients of various liquid systems. However, it is important to investigate the reasons (rather than to rationalize the observations as we did above) why diffusion coefficient of pure solvents, organic solutes in organic solvents and proteins in aqueous solution are underestimated. There are two kinds of factors that lead to the discrepancy: the molecular mechanical force field and the sampling protocol. Fox et al. pointed out that the self-diffusion coefficients of solvents are very sensitive to the densities.11 The lower density allows an easier movement of diffusive molecules, so the calculated D is likely to be overestimated; on the contrary, higher density is likely to lead to D underestimated. Certainly, density alone cannot explain the big discrepancy between the calculated and the experimental diffusion coefficients. The strength and anisotropy of the intermolecular interaction also play a key role in determining the solute-solvent interaction as well as the dynamic reorganization of the solvation structure. Therefore, it is expected that a good force field that can well predict some energetic properties, such as heat of vaporization, has a better chance to predict diffusion coefficient successfully. Recently, we have evaluated GAFF in predicting the interaction energies of 481 amino acid analog pairs. We found that the relative strengths of non-charge-charge interactions are overall underestimated using GAFF.91,92 This finding may partially explain why the diffusion coefficients of pure solvents and organic molecules in organic solvents are significantly underestimated.
Considering diffusion is a dynamic property, it is expected that more rigorous models, such as polarizable force fields based on the dipole interaction schemes of Applequist93 and Thole94,95 could outperform additive force fields in predicting diffusion coefficients since these polarizable models are able to respond to the changes in a dielectric environment. 91,92,96
Given the fact that GAFF inherits its van der Waals parameters from the AMBER biomolecular force fields, it is expected that the performance of diffusion prediction can be significantly improved after we tune the van der Waals parameters to reproduce the experimental densities and heats of vaporizations.1 We are in the process of reparameterizing GAFF including tuning van der Waals parameters in a systematic manner, how well does the new GAFF force field perform in predicting diffusion coefficient will be presented somewhere else.
Sampling is the other factor that influences the result of diffusion coefficient calculations. If the linear relation between MSD ~ simulation time doesn’t hold, the predicted D could be false. Longer MD simulation helps to increase the linearity between MSD ~ simulation time as illustrated by aniline solvent. The uncertainties of D and R2 are listed in Table 1 for the 35 liquid systems. It is clear that our calculation results are very reliable as the largest uncertainties of D and R2 are smaller than 0.05 and 0.06, respectively.
Besides the MD sampling, other MD settings that likely affect the diffusion coefficient calculation were also explored in this work. First of all, we studied how the size of simulation box affects the D calculation using TIP3P as an example. MD simulations were performed for three simulation boxes that have 375, 624 and 924 TIP3P water molecules and the calculated diffusion coefficients at 298K are 3.153, 2.984 and 3.097, respectively. This result suggests that diffusion coefficient is sensitive to the size of the simulation box. To mitigate the calculation error caused by simulation boxes, in this work we have tried to use large simulation boxes. For the solvents and small organic solutes, the simulation boxes are all larger than 30 × 30 × 30 Å3, while for the proteins in aqueous solution, the simulation boxes are larger than 60 × 60 × 60 Å3 and the largest one (for 1OVA) has the three dimensions of 86, 88 and 68 Å, respectively. Another important setting is whether the coordinates of MD trajectories are wrapped into the primary box or not. If so (iwrap = 1), when calculating MSD, the trajectories must be unwrapped properly. It should be pointed out that all the results discussed above are based on MD simulations without wrapping coordinates (iwrap = 0). The calculation results of diffusion coefficients using the MD trajectories wrapped into the primary boxes are summarized in Table S1. Obviously, the calculation results are very similar to those without wrapping coordinates.
4. Conclusions
This is the second paper in the series of predicting molecular properties using the General AMBER Force Field (GAFF). The diffusion coefficients of 35 liquids have been predicted through molecular dynamics simulations. The overall performance of the prediction is satisfactory: for the organic solutes in aqueous solution, the average unsigned error of 5 organic solutes is 0.137×10⁻⁹m2s−1; for other liquid systems, although the absolute values of diffusion coefficients cannot be well predicted, good correlations between calculated and experimental diffusion coefficients have been generated for all the other three individual categories. The correlation coefficients R2 are 0.784, 0.834 and 0.996 for pure organic solvents, organic solutes in organic solvents and proteins in aqueous solution, respectively. We have also attempted to rationalize the findings of diffusion coefficient calculations from the microscopic perspective. The major factors that affect the diffusion coefficient calculation have also been discussed. Given the fact that GAFF inherits its van der Waals parameters from the AMBER biomolecular force fields without further optimization, it is very likely that the performance of predicting diffusion coefficients using GAFF can be significantly improved after a systematic van der Waals parameterization.
An effective sampling protocol has been proposed to improve the linearity of MSD ~ simulation time plots. This sampling protocol has been successfully applied in calculating diffusion coefficients of solutes at infinite dilution. The major objective of this study, developing effective computational protocols of calculating diffusion coefficients for various diffusion systems, has been achieved.
Supplementary Material
Acknowledgments
We are grateful to acknowledge the research support from NIH (R01GM79383, Y. Duan, P.I.) and Natural Science Foundation of China (No. 20973121, T. Hou, P.I.), and TeraGrid (TG-CHE090098, J. Wang, P.I.) and TACC (pdz, J. Wang, P.I.) for the computer time.
Abbreviations
- GAFF
the general AMBER force field
- MD
molecular dynamics
- vdW
van der Waals
- D
diffusion coefficient
- MSD
mean square displacement
- AUE
average unsigned errors
- RMSE
root-mean-square errors
- APE
average percent errors
- R2
correlation coefficient square
- DMSO
dimethyl sulfoxide
- NMA
N-methyl aceticamide
- CHCl3
trichloromethane
- CCl4
tetrachloromethane
Footnotes
Supporting Information Available:
The results of calculating diffusion coefficients using the MD protocol of wrapping MD coordinates into the primary simulation boxes are summarized in Table S1. The residue topology (heme.prepi) and force field parameters (heme.frcmod) of HEME developed in this work are also provided. This material is available free of charge via the Internet at http://pubs.acs.org.
References
- 1.Wang JM, Hou TJ. J Chem Theory Comput. 2011 ePub, ahead of print. [Google Scholar]
- 2.Georgalis Y, Starikov EB, Hollenbach B, Lurz R, Scherzinger E, Saenger W, Lehrach H, Wanker EE. Proc Natl Acad Sci U S A. 1998;95(11):6118–6121. doi: 10.1073/pnas.95.11.6118. [DOI] [PMC free article] [PubMed] [Google Scholar]
- 3.Krewson CE, Saltzman WM. Brain Res. 1996;727(1-2):169–181. doi: 10.1016/0006-8993(96)00378-2. [DOI] [PubMed] [Google Scholar]
- 4.Tellez CM, Cole KD. Electrophoresis. 2000;21(5):1001–1009. doi: 10.1002/(SICI)1522-2683(20000301)21:5<1001::AID-ELPS1001>3.0.CO;2-3. [DOI] [PubMed] [Google Scholar]
- 5.Yu HB, Hansson T, van Gunsteren WF. Journal Of Chemical Physics. 2003;118(1):221–234. [Google Scholar]
- 6.Lee SH. B Korean Chem Soc. 2009;30(9):2158–2160. [Google Scholar]
- 7.Li W, Chen C, Yang J. Heat Transfer-Asian Research. 2008;37(2):86–93. [Google Scholar]
- 8.Levitt M, Hirshberg M, Sharon R, Laidig KE, Daggett V. Journal of Physical Chemistry B. 1997;101(25):5051–5061. [Google Scholar]
- 9.Mark P, Nilsson L. Journal of Physical Chemistry B. 2001;105(43):9954–9960. [Google Scholar]
- 10.Vishnyakov A, Lyubartsev AP, Laaksonen A. Journal of Physical Chemistry A. 2001;105(10):1702–1710. [Google Scholar]
- 11.Fox T, Kollman PA. Journal of Physical Chemistry B. 1998;102(41):8070–8079. [Google Scholar]
- 12.Caldwell JW, Kollman PA. Journal of Physical Chemistry. 1995;99(16):6208–6219. [Google Scholar]
- 13.Nuevo MJ, Morales JJ, Heyes DM. Phys Rev E. 1998;58(5):5845–5854. [Google Scholar]
- 14.Harmandaris VA, Angelopoulou D, Mavrantzas VG, Theodorou DN. Journal Of Chemical Physics. 2002;116(17):7656–7665. [Google Scholar]
- 15.Nath SK, Escobedo FA, de Pablo JJ. Journal Of Chemical Physics. 1998;108(23):9905–9911. [Google Scholar]
- 16.Zervopoulou E, Mavrantzas VG, Theodorou DN. Journal Of Chemical Physics. 2001;115(6):2860–2875. [Google Scholar]
- 17.Mantina M, Wang Y, Arroyave R, Chen LQ, Liu ZK, Wolverton C. Physical Review Letters. 2008;100(21):215901. doi: 10.1103/PhysRevLett.100.215901. [DOI] [PubMed] [Google Scholar]
- 18.Yoshida K, Matubayasi N, Nakahara M. J Chem Phys. 2007;127(17):174509. doi: 10.1063/1.2780871. [DOI] [PubMed] [Google Scholar]
- 19.Yoshida K, Matubayasi N, Nakahara M. Journal Of Chemical Physics. 2008;129(21):214501. doi: 10.1063/1.3006420. [DOI] [PubMed] [Google Scholar]
- 20.Krynicki K, Green CD, Sawyer DW. Faraday Discuss. 1978;(66):199–208. [Google Scholar]
- 21.Rah K, Kwak S, Eu BC, Lafleur M. Journal of Physical Chemistry A. 2002;106(48):11841–11845. [Google Scholar]
- 22.Ruckenstein E, Liu HQ. Ind Eng Chem Res. 1997;36(9):3927–3936. [Google Scholar]
- 23.Liu HQ, Silva CM, Macedo EA. Chem Eng Sci. 1998;53(13):2403–2422. [Google Scholar]
- 24.Dariva C, Coelho LAF, Oliveira JV. Fluid Phase Equilibr. 1999;160:1045–1054. [Google Scholar]
- 25.Zhu Y, Lu XH, Zhou J, Wang YR, Shi J. Fluid Phase Equilibr. 2002;194:1141–1159. [Google Scholar]
- 26.Zabaloy MS, Vasquez VR, Macedo EA. Fluid Phase Equilibr. 2006;242(1):43–56. [Google Scholar]
- 27.Lee H, Thodos G. Ind Eng Chem Fund. 1983;22(1):17–26. [Google Scholar]
- 28.Suarez-Iglesias O, Medina I, Pizarro C, Bueno JL. Fluid Phase Equilibr. 2008;269(1-2):80–92. [Google Scholar]
- 29.Sagarik K, Spohr E. Chemical Physics. 1995;199(1):73–82. [Google Scholar]
- 30.Dymond JH. Chem Soc Rev. 1985;14(3):317–356. [Google Scholar]
- 31.Yu YX, Gao GH. Fluid Phase Equilibr. 1999;166(1):111–124. [Google Scholar]
- 32.Chapman WG, Gubbins KE, Jackson G, Radosz M. Ind Eng Chem Res. 1990;29(8):1709–1721. [Google Scholar]
- 33.Yu YX, Gao CH. Fluid Phase Equilibr. 2001;179(1-2):165–179. [Google Scholar]
- 34.Brenner H. J Colloid Interf Sci. 1967;23(3):407–436. [Google Scholar]
- 35.Brune D, Kim S. Proc Natl Acad Sci U S A. 1993;90(9):3835–3839. doi: 10.1073/pnas.90.9.3835. [DOI] [PMC free article] [PubMed] [Google Scholar]
- 36.Zhao H, Pearlstein AJ. Physics of Fluids. 2002;14(7):2376–2387. [Google Scholar]
- 37.Gonzalez O, Li J. J Chem Phys. 2008;129(16):165105. doi: 10.1063/1.2992080. [DOI] [PubMed] [Google Scholar]
- 38.Kang EH, Mansfield ML, Douglas JF. Phys Rev E Stat Nonlin Soft Matter Phys. 2004;69(3 Pt 1):031918. doi: 10.1103/PhysRevE.69.031918. [DOI] [PubMed] [Google Scholar]
- 39.Landolt-Bornstein . II/5a. Springer-Verlag; Heidelberg: 1969. [Google Scholar]
- 40.Hurle RL, Woolf LA. Australian Journal of Chemistry. 1980;33(9):1947–1952. [Google Scholar]
- 41.Bender HJ, Zeidler MD. Berich Bunsen Gesell. 1971;75(3-4):236–242. [Google Scholar]
- 42.Collings AF, Mills R. T Faraday Soc. 1970;66(575):2761–2766. [Google Scholar]
- 43.Liu HY, Mullerplathe F, Vangunsteren WF. Journal of the American Chemical Society. 1995;117(15):4363–4366. [Google Scholar]
- 44.Sehgal CM. Ultrasonics. 1995;33(2):155–161. [Google Scholar]
- 45.Easteal AJ, Price WE, Woolf LA. J Chem Soc Farad T 1. 1989;85:1091–1097. [Google Scholar]
- 46.Holz M, Heil SR, Sacco A. Phys Chem Chem Phys. 2000;2(20):4740–4742. [Google Scholar]
- 47.Gillen KT, Douglass DC, Hoch JR. Journal Of Chemical Physics. 1972;57(12):5117–5119. [Google Scholar]
- 48.Mills R. Journal of Physical Chemistry. 1973;77(5):685–688. [Google Scholar]
- 49.Tiddy GJT. J Chem Soc Farad T 1. 1977;73:1731–1737. [Google Scholar]
- 50.Zhang X, Li CG, Ye CH, Liu ML. Analytical Chemistry. 2001;73(15):3528–3534. doi: 10.1021/ac0101104. [DOI] [PubMed] [Google Scholar]
- 51.Jacob AC, Zeidler MD. Phys Chem Chem Phys. 2003;5(3):538–542. [Google Scholar]
- 52.James TL, Mcdonald GG. J Magn Reson. 1973;11(1):58–61. [Google Scholar]
- 53.Scharfenecker A, Ardelean I, Kimmich R. J Magn Reson. 2001;148(2):363–366. doi: 10.1006/jmre.2000.2250. [DOI] [PubMed] [Google Scholar]
- 54.Niesner R, Heintz A. J Chem Eng Data. 2000;45(6):1121–1124. [Google Scholar]
- 55.Williams WD, Ellard JA, Dawson LR. J Am Chem Soc. 1957;79(17):4652–4654. [Google Scholar]
- 56.Gutenwik J, Nilsson B, Axelsson A. Biochem Eng J. 2004;19(1):1–7. [Google Scholar]
- 57.Larew LA, Walters RR. Anal Biochem. 1987;164(2):537–546. doi: 10.1016/0003-2697(87)90530-6. [DOI] [PubMed] [Google Scholar]
- 58.Fuh CB, Levin S, Giddings JC. Anal Biochem. 1993;208(1):80–87. doi: 10.1006/abio.1993.1011. [DOI] [PubMed] [Google Scholar]
- 59.Liu MK, Li P, Giddings JC. Protein Sci. 1993;2(9):1520–1531. doi: 10.1002/pro.5560020917. [DOI] [PMC free article] [PubMed] [Google Scholar]
- 60.Krishnan VV. J Magn Reson. 1997;124(2):468–473. doi: 10.1006/jmre.1996.1037. [DOI] [PubMed] [Google Scholar]
- 61.Annunziata O, Paduano L, Pearlstein AJ, Miller DG, Albright JG. Journal of the American Chemical Society. 2000;122(25):5916–5928. [Google Scholar]
- 62.Dubin SB, Clark NA, Benedek GB. Journal Of Chemical Physics. 1971;54(12):5158–5164. [Google Scholar]
- 63.Sober HA. CRC Press; Cleveland, Ohio: 1970. pp. C3–C39. [Google Scholar]
- 64.Berman HM, Westbrook J, Feng Z, Gilliland G, Bhat TN, Weissig H, Shindyalov IN, Bourne PE. Nucleic Acids Res. 2000;28(1):235–242. doi: 10.1093/nar/28.1.235. [DOI] [PMC free article] [PubMed] [Google Scholar]
- 65.Bushnell GW, Louie GV, Brayer GD. J Mol Biol. 1990;214(2):585–595. doi: 10.1016/0022-2836(90)90200-6. [DOI] [PubMed] [Google Scholar]
- 66.Dong J, Boggon TJ, Chayen NE, Raftery J, Bi RC, Helliwell JR. Acta Crystallogr D. 1999;55:745–752. doi: 10.1107/s0907444998016047. [DOI] [PubMed] [Google Scholar]
- 67.Pjura PE, Lenhoff AM, Leonard SA, Gittis AG. Journal of Molecular Biology. 2000;300(2):235–239. doi: 10.1006/jmbi.2000.3851. [DOI] [PubMed] [Google Scholar]
- 68.Stein PE, Leslie AGW, Finch JT, Carrell RW. Journal of Molecular Biology. 1991;221(3):941–959. doi: 10.1016/0022-2836(91)80185-w. [DOI] [PubMed] [Google Scholar]
- 69.Bayly CI, Cieplak P, Cornell WD, Kollman PA. Journal Of Physical Chemistry. 1993;97(40):10269–10280. [Google Scholar]
- 70.Cieplak P, Cornell WD, Bayly C, Kollman PA. J Comp Chem. 1995;16(11):1357–1377. [Google Scholar]
- 71.Frisch MJ, Trucks GW, Schlegel HB, Scuseria GE, Robb MA, Cheeseman JR, Montgomery J, Vreven T, Kudin KN, Burant JC, Millam JM, Iyengar SS, Tomasi J, Barone V, Mennucci B, Cossi M, Scalmani G, Rega N, Petersson GA, Nakatsuji H, Hada M, Ehara M, Toyota K, Fukuda R, Hasegawa J, Ishida M, Nakajima T, Honda Y, Kitao O, Nakai H, Klene M, Li X, Knox JE, Hratchian HP, Cross JB, Bakken V, Adamo C, Jaramillo J, Gomperts R, Stratmann RE, Yazyev O, Austin AJ, Cammi R, Pomelli C, Ochterski JW, Ayala PY, Morokuma K, Voth GA, Salvador P, Dannenberg JJ, Zakrzewski VG, Dapprich S, Daniels AD, Strain MC, Farkas O, Malick DK, Rabuck AD, Raghavachari K, Foresman JB, Ortiz JV, Cui Q, Baboul AG, Clifford S, Cioslowski J, Stefanov BB, Liu G, Liashenko A, Piskorz P, Komaromi I, Martin RL, Fox DJ, Keith T, Al-Laham MA, Peng CY, Nanayakkara A, Challacombe M, Gill PMW, Johnson B, Chen W, Wong MW, Gonzalez C, Pople JA. Gaussian, Inc; Wallingford CT: 2004. J. A. [Google Scholar]
- 72.Case DA, Darden TA, Cheatham I, Simmerling C, Wang J, Duke RE, Luo R, Crowley M, Walker RC, Zhang W, Merz KM, Wang B, Hayik S, Roitberg A, Seabra G, Kolossvary I, Wong KF, Paesani F, Vanicek J, Wu X, Brozell SR, Steinbrecher T, Gohlke H, Yang L, Tan C, Mongan J, Hornak V, Cui G, Mathews DH, Seetin MG, Sagui C, Babin V, Kollman PA. University of California; San Francisco: 2008. T. E. [Google Scholar]
- 73.Wang JM, Wang W, Kollman PA, Case DA. Journal of Molecular Graphics & Modelling. 2006;25(2):247–260. doi: 10.1016/j.jmgm.2005.12.005. [DOI] [PubMed] [Google Scholar]
- 74.Hornak V, Abel R, Okur A, Strockbine B, Roitberg A, Simmerling C. Proteins: Structure, Function, and Bioinformatics. 2006;65(3):712–725. doi: 10.1002/prot.21123. [DOI] [PMC free article] [PubMed] [Google Scholar]
- 75.Wang JM, Cieplak P, Kollman PA. Journal of Computational Chemistry. 2000;21(12):1049–1074. [Google Scholar]
- 76.Darden T, Perera L, Li L, Pedersen L. Structure. 1999;7(3):R55–60. doi: 10.1016/s0969-2126(99)80033-1. [DOI] [PubMed] [Google Scholar]
- 77.Essmann U, Perera L, Berkowitz ML, Darden T, Lee H, Pedersen LG. J Chem Phys. 1995;103(19):8577–8593. [Google Scholar]
- 78.Sagui C, Pedersen LG, Darden TA. Journal Of Chemical Physics. 2004;120(1):73–87. doi: 10.1063/1.1630791. [DOI] [PubMed] [Google Scholar]
- 79.Miyamoto S, Kollman PA. Journal of Computational Chemistry. 1992;13(8):952–962. [Google Scholar]
- 80.Ryckaert JP, Ciccotti G, Berendsen HJC. J Comput Phys. 1977;23(3):327–341. [Google Scholar]
- 81.Uberuaga BP, Anghel M, Voter AF. J Chem Phys. 2004;120(14):6363–6374. doi: 10.1063/1.1667473. [DOI] [PubMed] [Google Scholar]
- 82.Izaguirre JA, Catarello DP, Wozniak JM, Skeel RD. Journal Of Chemical Physics. 2001;114(5):2090–2098. [Google Scholar]
- 83.Larini L, Mannella R, Leporini D. J Chem Phys. 2007;126(10):104101. doi: 10.1063/1.2464095. [DOI] [PubMed] [Google Scholar]
- 84.Loncharich RJ, Brooks BR, Pastor RW. Biopolymers. 1992;32(5):523–535. doi: 10.1002/bip.360320508. [DOI] [PubMed] [Google Scholar]
- 85.Harris KR, Lam HN, Raedt E, Easteal AJ, Price WE, Woolf LA. Mol Phys. 1990;71(6):1205–1221. [Google Scholar]
- 86.Oreilly DE. Journal Of Chemical Physics. 1968;49(12):5416. [Google Scholar]
- 87.Moelwyn-Hughes EA. Academic Press; New York: 1971. [Google Scholar]
- 88.Cebe E, Kaltenmeier D, Hertz HG. Z Phys Chem Neue Fol. 1984;140(2):181–189. [Google Scholar]
- 89.Meckl S, Zeidler MD. Mol Phys. 1988;63(1):85–95. [Google Scholar]
- 90.Safi A, Nicolas C, Neau E, Chevalier JL. J Chem Eng Data. 2007;52(3):977–981. [Google Scholar]
- 91.Wang JM, Cieplak P, Li J, Hou TJ, Luo R, Duan Y. Journal of Physical Chemistry B. 2011;115(12):3091–3099. doi: 10.1021/jp112133g. [DOI] [PMC free article] [PubMed] [Google Scholar]
- 92.Wang JM, Cieplak P, Li J, Wang J, Cai Q, Hsieh MJ, Lei HX, Luo R, Duan Y. Journal of Physical Chemistry B. 2011;115(12):3100–3111. doi: 10.1021/jp1121382. [DOI] [PMC free article] [PubMed] [Google Scholar]
- 93.Applequist J, Carl JR, Fung KK. Journal of the American Chemical Society. 1972;94(9):2952–2960. [Google Scholar]
- 94.Thole BT. Chemical Physics. 1981;59(3):341–350. [Google Scholar]
- 95.van Duijnen PT, Swart M. Journal of Physical Chemistry A. 1998;102(14):2399–2407. [Google Scholar]
- 96.Cieplak P, Dupradeau FY, Duan Y, Wang JM. J Phys-Condens Mat. 2009;21(33):333102. doi: 10.1088/0953-8984/21/33/333102. [DOI] [PMC free article] [PubMed] [Google Scholar]
Associated Data
This section collects any data citations, data availability statements, or supplementary materials included in this article.


