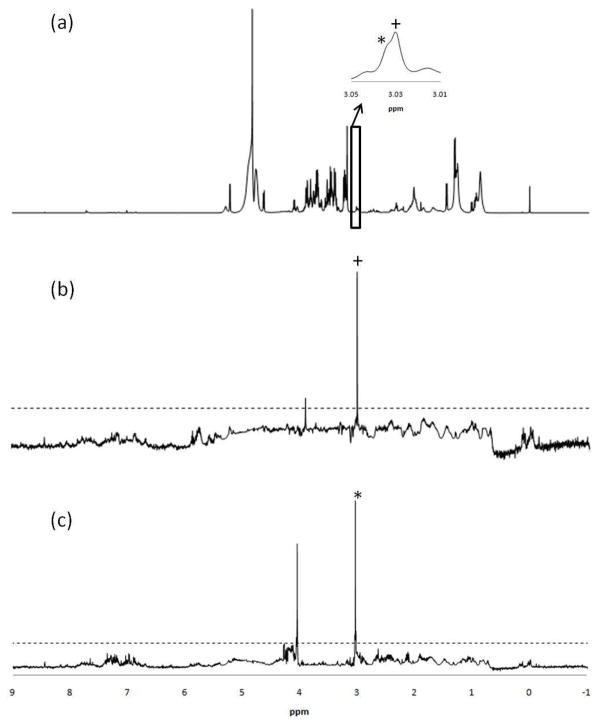
Figure 2.
(a) 1H NMR spectrum of serum, obtained using the CPMG pulse sequence; (b) Selective detection of creatine by the RANSY method. The driving peak is at 3.02 ppm (indicated by the plus sign); (c) Selective detection of creatinine driven by the singlet at 3.03 ppm (indicated by the asterisk). The noise threshold value of R = 6 is indicated by the dashed horizontal line in both (b) and (c). The inset in (a) shows the two very closely spaced peaks for creatine and creatinine used as driving peaks.

