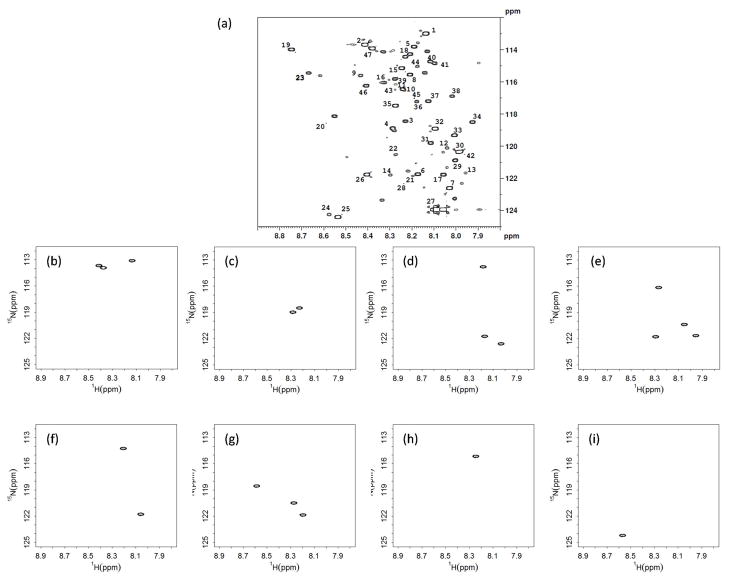
Figure 4.
(a) A 1H-15N HSQC spectrum of a standard mixture containing 33 metabolites with identifications and concentrations given in Table S-1. Examples of metabolites detected by RANSY: (b) lactic acid (peaks 1,2,47); (c) glucuronic acid (3,4); (d) citric acid (5,6,7); (e) isocitric acid (11,12,13,14); (f) malic acid (17,18); (g) cis-aconitic acid (20,21,22); (h) leucine (15); and (i) betaine (24). Individual HSQC spectra (b)-(i) were generated by thresholding the RANSY ratio of peaks above a value, R ≥ 6.5.

