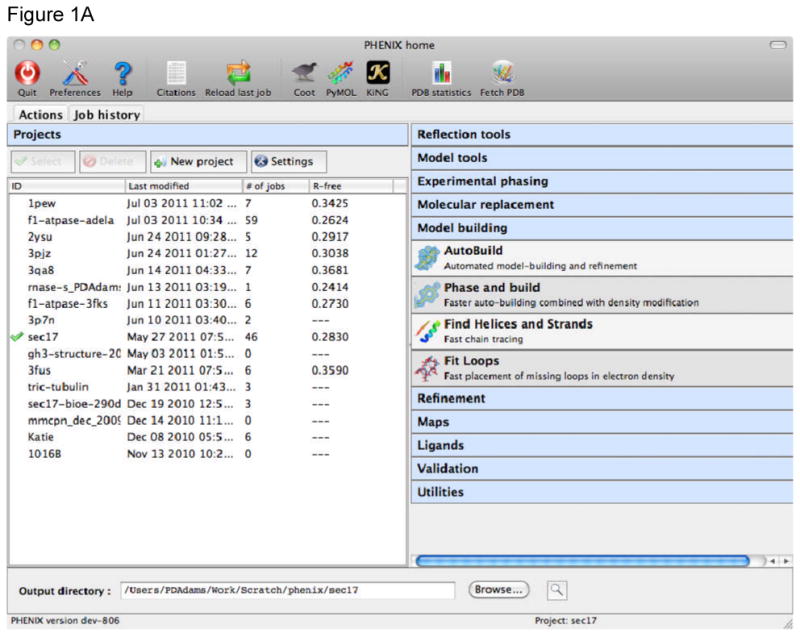
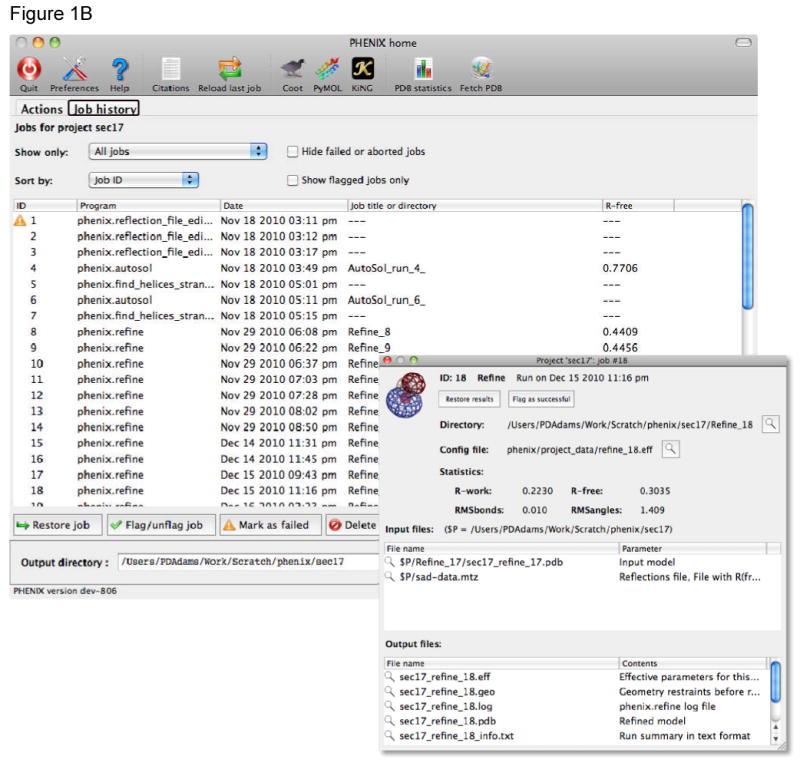
Figure 1.


A) The main Phenix graphical user interface (GUI) window. User projects are shown on the left of the window, with the current project shown with a green check mark. Projects can be created, selected and deleted. The procedures that can be applied to the data within a project are shown on the right of the main window. Each blue banner can be folded or unfolded with a mouse click, revealing the available programs (those for model building are shown here). A number of other tools are available through the icons at the top of the window, or from pull down menus. B) The Job History tab is used to provide a list of the jobs run within a project. The job name, date of execution, directory containing the results, and free R-factor at the end of the job (if applicable) are recorded. Details for a job can be viewed with the Show details button (details window shown as inset).
