Figure 3.


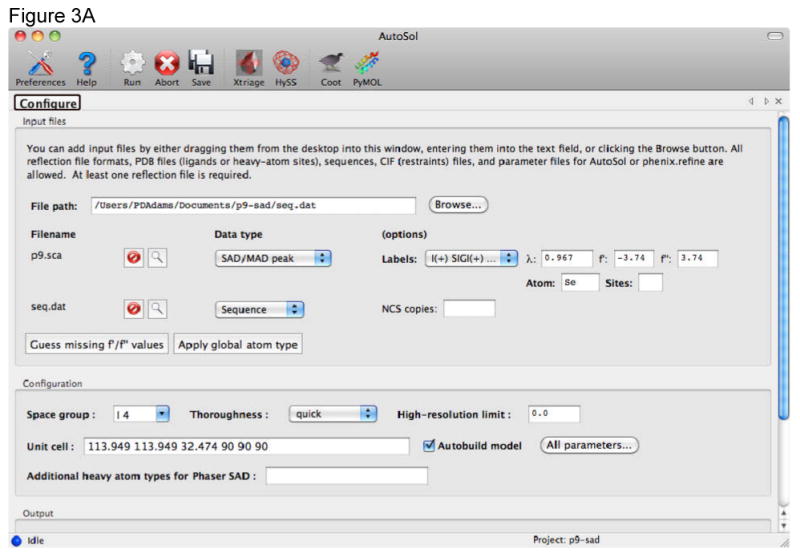
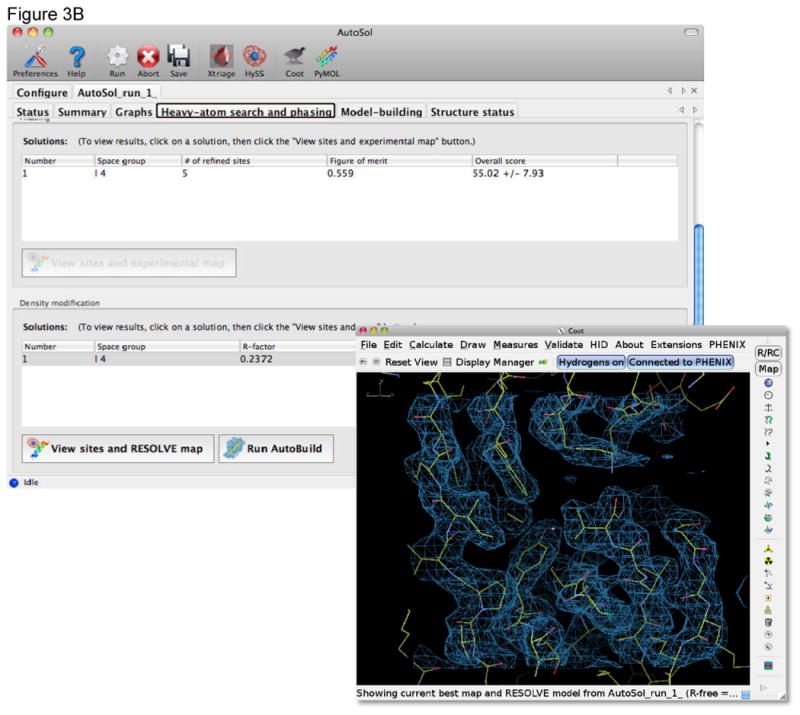
Automated structure solution and initial model building with the Autosol wizard in Phenix. A) The Configuration tab provides dynamic input fields for diffraction data and the sequence of the molecules in the crystal. The type of the data set can be set using pull down menus. For a SAD experiment it is typically sufficient to provide the anomalous data set, the wavelength at which it was collected, the anomalous scatterer type and the sequence of the molecule (protein or nucleic acid). Values for f′ and f″ can be calculated by the GUI using tables internal to Phenix. In most cases the full resolution of the data is used and automated initial model building performed. B) As the job is running a number of new tabs are generated providing information about the run. The Summary tab provides access to the files produced during heavy atom location, phasing, density modification and model building. The Heavy-atom search and phasing tab scores for each solution pursued by the wizard and buttons to allow easy viewing of these solutions in Coot or PyMOL[32].
