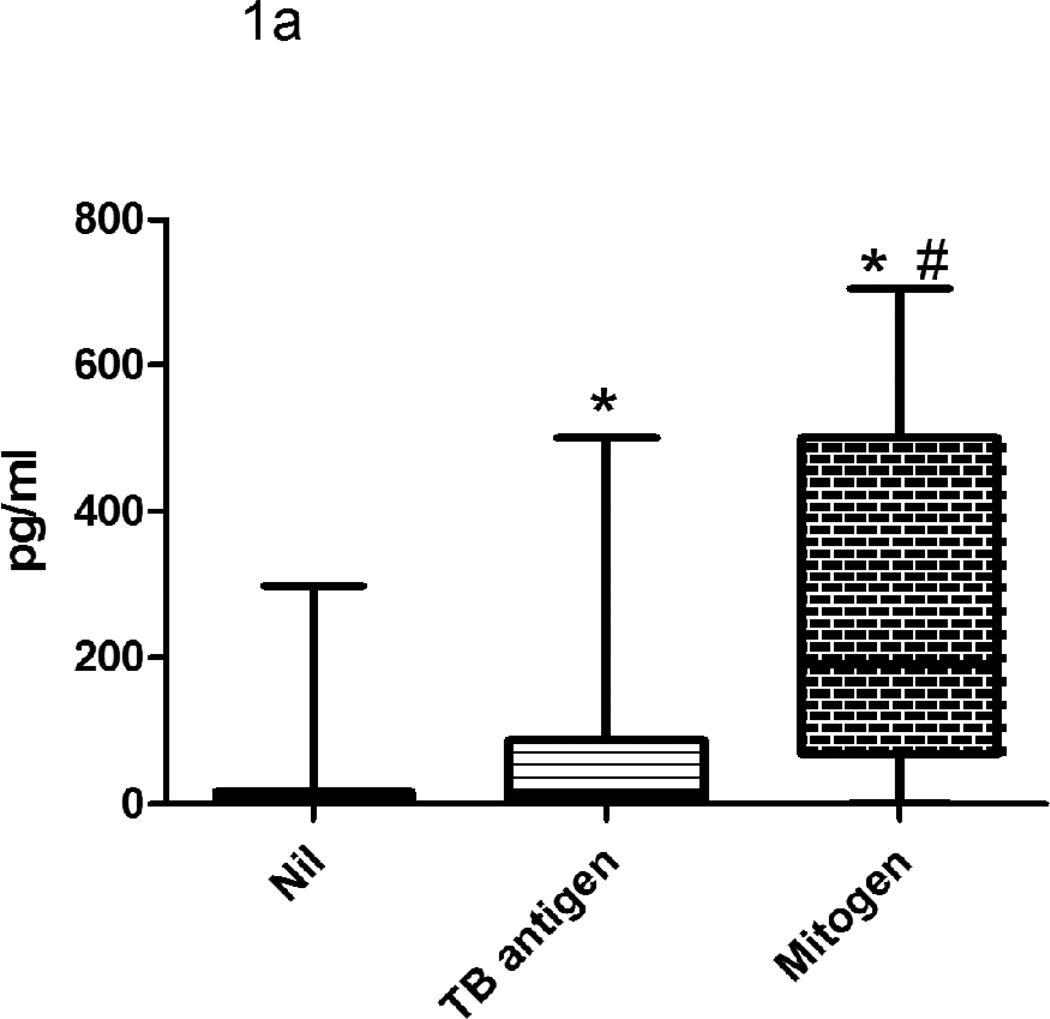
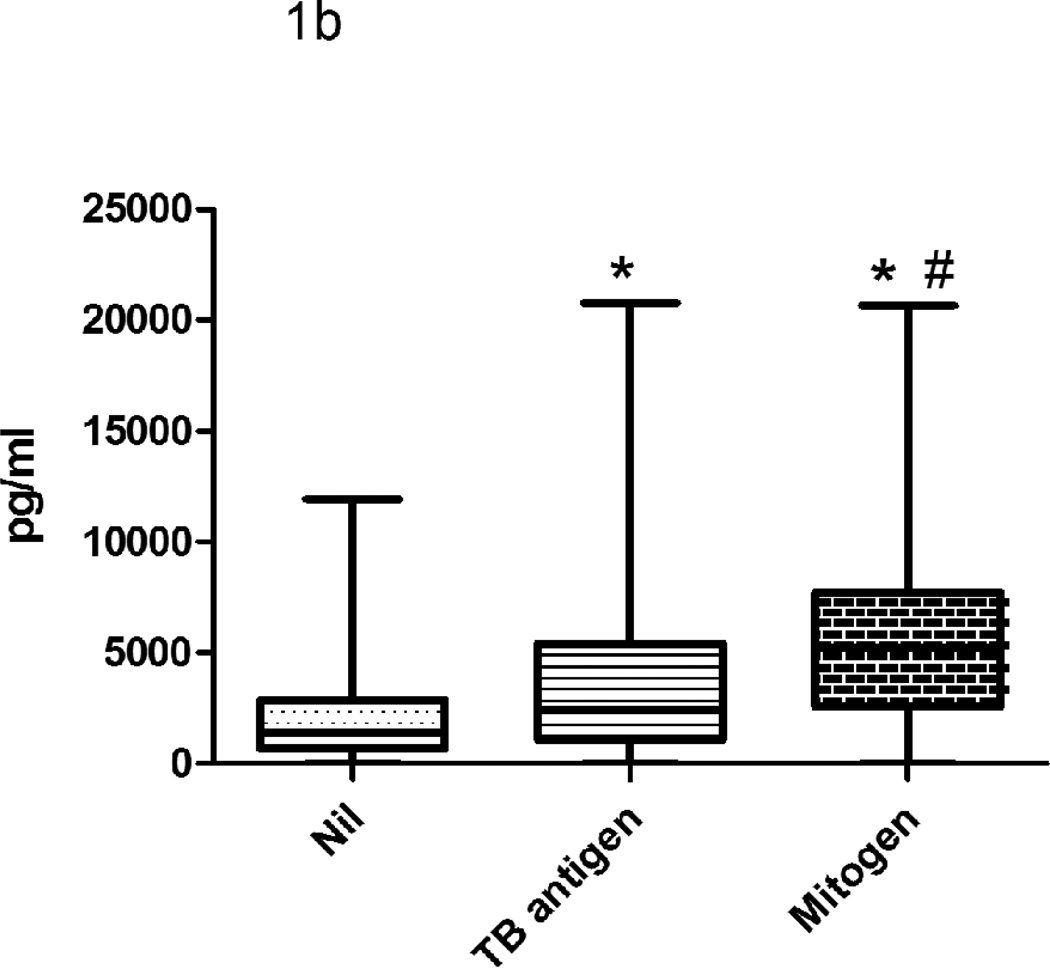
Figure 1. The levels of IFN-γ (a) and IP-10 (b) secretion in QFT-IT NIL, QFT-IT TB antigen stimulated and QFT-IT mitogen stimulated samples.
The levels of IFN-γ and IP-10 were significantly higher in QFT-IT TB antigens stimulated, as well as QFT-IT mitogen stimulated samples when compared to QFT-IT NIL samples. Box and Whisker plots show range, inter-quartile range and median. The difference between the groups was calculated by Kruskal-Wallis test. *significant difference p<0.001 compared to unstimulated sample, # significant difference p<0.001 compared to QFT-IT TB specific antigens stimulated sample. QFT-IT – QuantiFERON-TB Gold in-tube, TB- Tuberculosis


