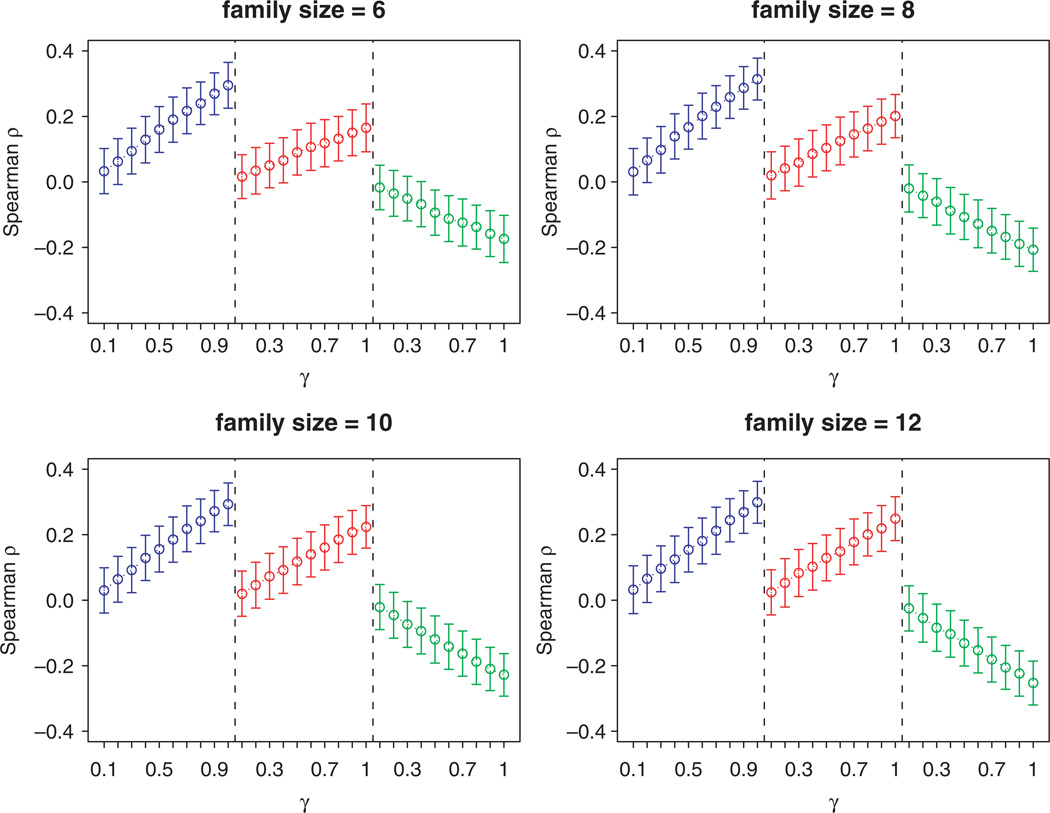
Figure 1.
Mean (s.e.) of correlation coefficient between the estimated family risk score and the true family risk. β0 = 2, β1 = 0.5, β2 = 0.1 (SLFS, Williams et al.’s family risk score, and Reed et al.’s are in the left, middle, and right panels, respectively and shown in blue, red, and green in the online figure.).

