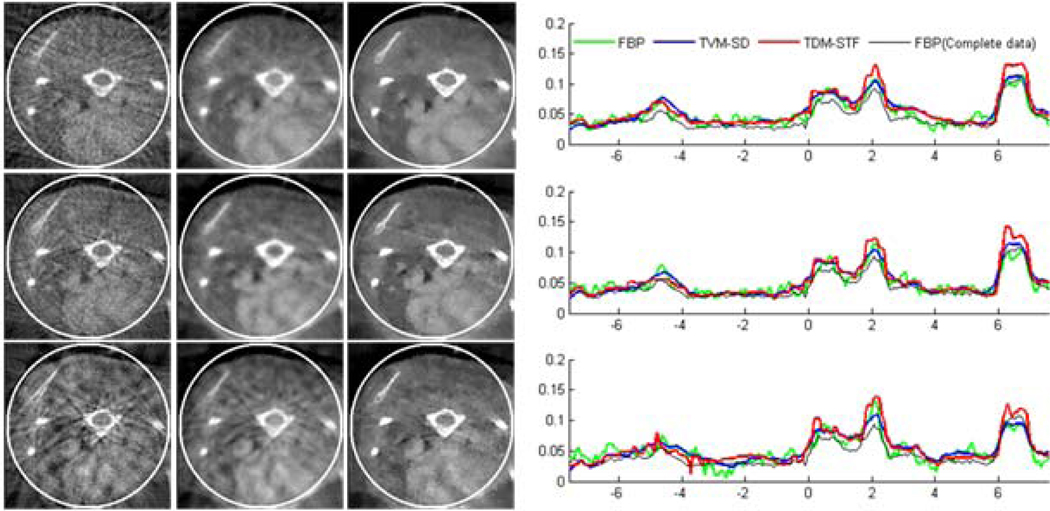
Figure 11.
Reconstructed images from truncated anesthetized free-breathing mouse dataset with 11 sources in a display window [0, 0.1]. From top to bottom in the left panel, the images were reconstructed from full-scan, half-scan and one-third-scan, respectively. From left to right, the images were reconstructed by the classical FBP, TVM-SD method after 100 iterations (one TV minimization in each main loop), and the TDM-STF method after 100 iterations (one soft-threshold filtering in each main loop). And the right panel shows image profiles along the horizontal central lines in the left panel, respectively.

