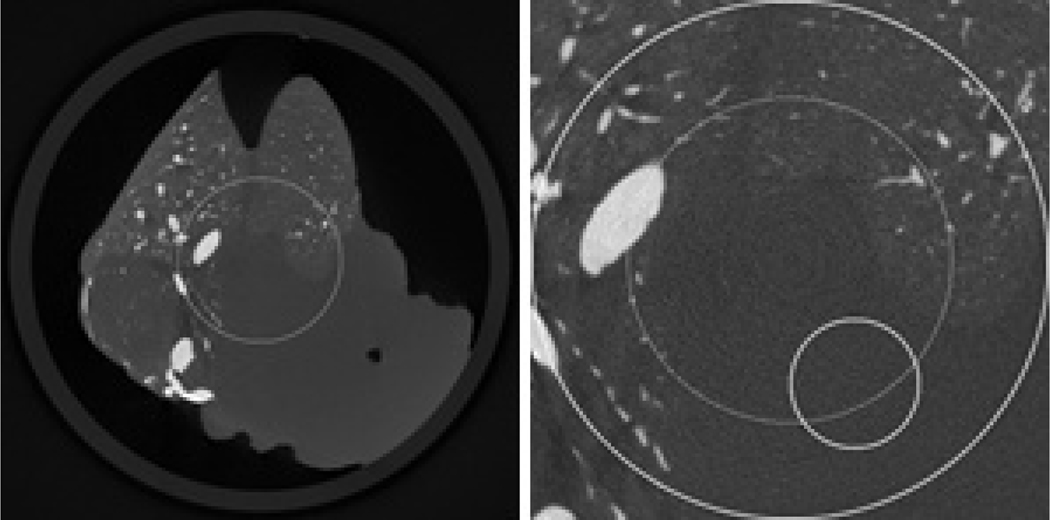
Figure 12.
Reconstructed images from a un-truncated dead mouse dataset using the classical FBP method in a display window [0, 0.34]. While the left is the whole image, the right is a magnified ROI whose diameter is 6.95 mm. In the right image, the large circle indicates the ROI, the medium circle indicates the sub-region where the RMSEs will be measured, and the small circle indicates the sub-region where the standard deviations will be measured.

