Figure 4.

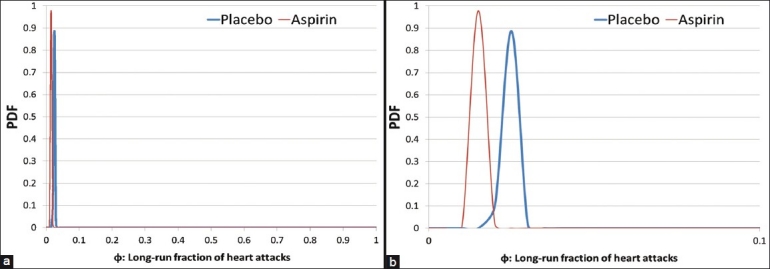
(a)Posterior distributions resulting from the aspirin study. (b) Posterior distributions with exaggerated differences by zooming the x-axis

(a)Posterior distributions resulting from the aspirin study. (b) Posterior distributions with exaggerated differences by zooming the x-axis