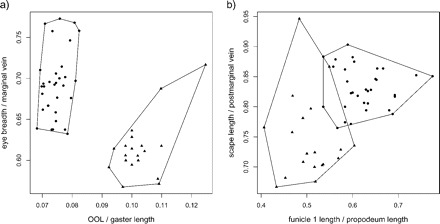
FIGURE 1.

Scatter plots of the four most discriminating ratios for Pteromalus albipennis (dots) and P. solidaginis (triangles). Plot (a) shows first versus second ratio, plot (b) third versus fourth ratio.

Scatter plots of the four most discriminating ratios for Pteromalus albipennis (dots) and P. solidaginis (triangles). Plot (a) shows first versus second ratio, plot (b) third versus fourth ratio.