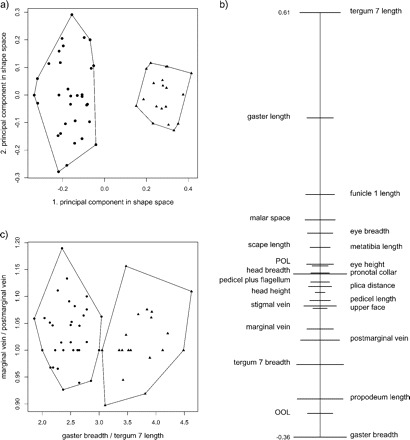
FIGURE 2.

Application of the PCA ratio spectrum using the Pteromalus data, with Pteromalus albipennis (dots) and P. solidaginis (triangles). (a) Scatterplot of a principal component analysis (PCA) in shape space. (b) PCA ratio spectrum of the first principal component. The ratio formed from the extremal points (i.e., gaster breadth:tergum 7 length) explains a large part of the variation of the first component. In contrast, ratios formed from characters lying close to each other in the spectrum (e.g., marginal vein:postmarginal vein) explain very little. This is apparent in the scatterplot (c). Confidence intervals (horizontal bars in (b), see Methodology section) were estimated with a bootstrap.
