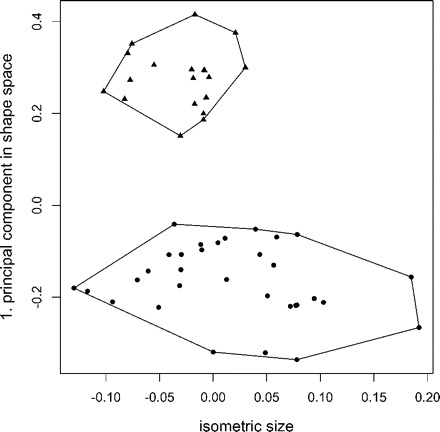
FIGURE 3.

Scatterplot of isometric size versus first principal component in shape space for the Pteromalus data set, with Pteromalus albipennis (dots) and P. solidaginis (triangles). The mean size of P. solidaginis is obviously smaller but it still lies within the range of Pteromalus albipennis.
